
- abstracts across four fields
- 112,903
- name a quantitative method
- 25%
- of 27,780 mention a power analysis
- 14
Which statistical methods do recent dissertations actually use? Our four methods series answered that field by field: psychology, education, business, and the social sciences and health. This benchmark pools them: 112,903 English-language dissertation and thesis abstracts published from 2021 through September 2026, of which 27,780 (25%) name at least one quantitative method.
The full table, with confidence intervals, field-by-field shares, and change over time for 36 methods, is free to download as a CSV file under a CC BY 4.0 license. If you use it, please cite this page; the suggested citation is at the end.
The short version
- Five methods lead: correlation (18% of method-naming abstracts), linear regression (14%), mediation (13%), moderation (10%), and reliability (10%).
- Explanatory models are the norm. One in eight method-naming abstracts tests mediation, more than name a t test and ANOVA combined.
- Each field has a fingerprint. Education leans on t tests and reliability, business on regression, SEM, and PLS-SEM, psychology on mediation and moderation, and economics-heavy social science on panel data and causal designs.
- Rigor markers are nearly absent. Only 14 of 27,780 method-naming abstracts mention a power analysis, and 88 mention how they handled missing data.
- Reliability reporting, machine learning, SEM, PLS-SEM, and panel data are rising, though changes in OpenAlex's coverage may explain part of that.
The methods dissertations name most
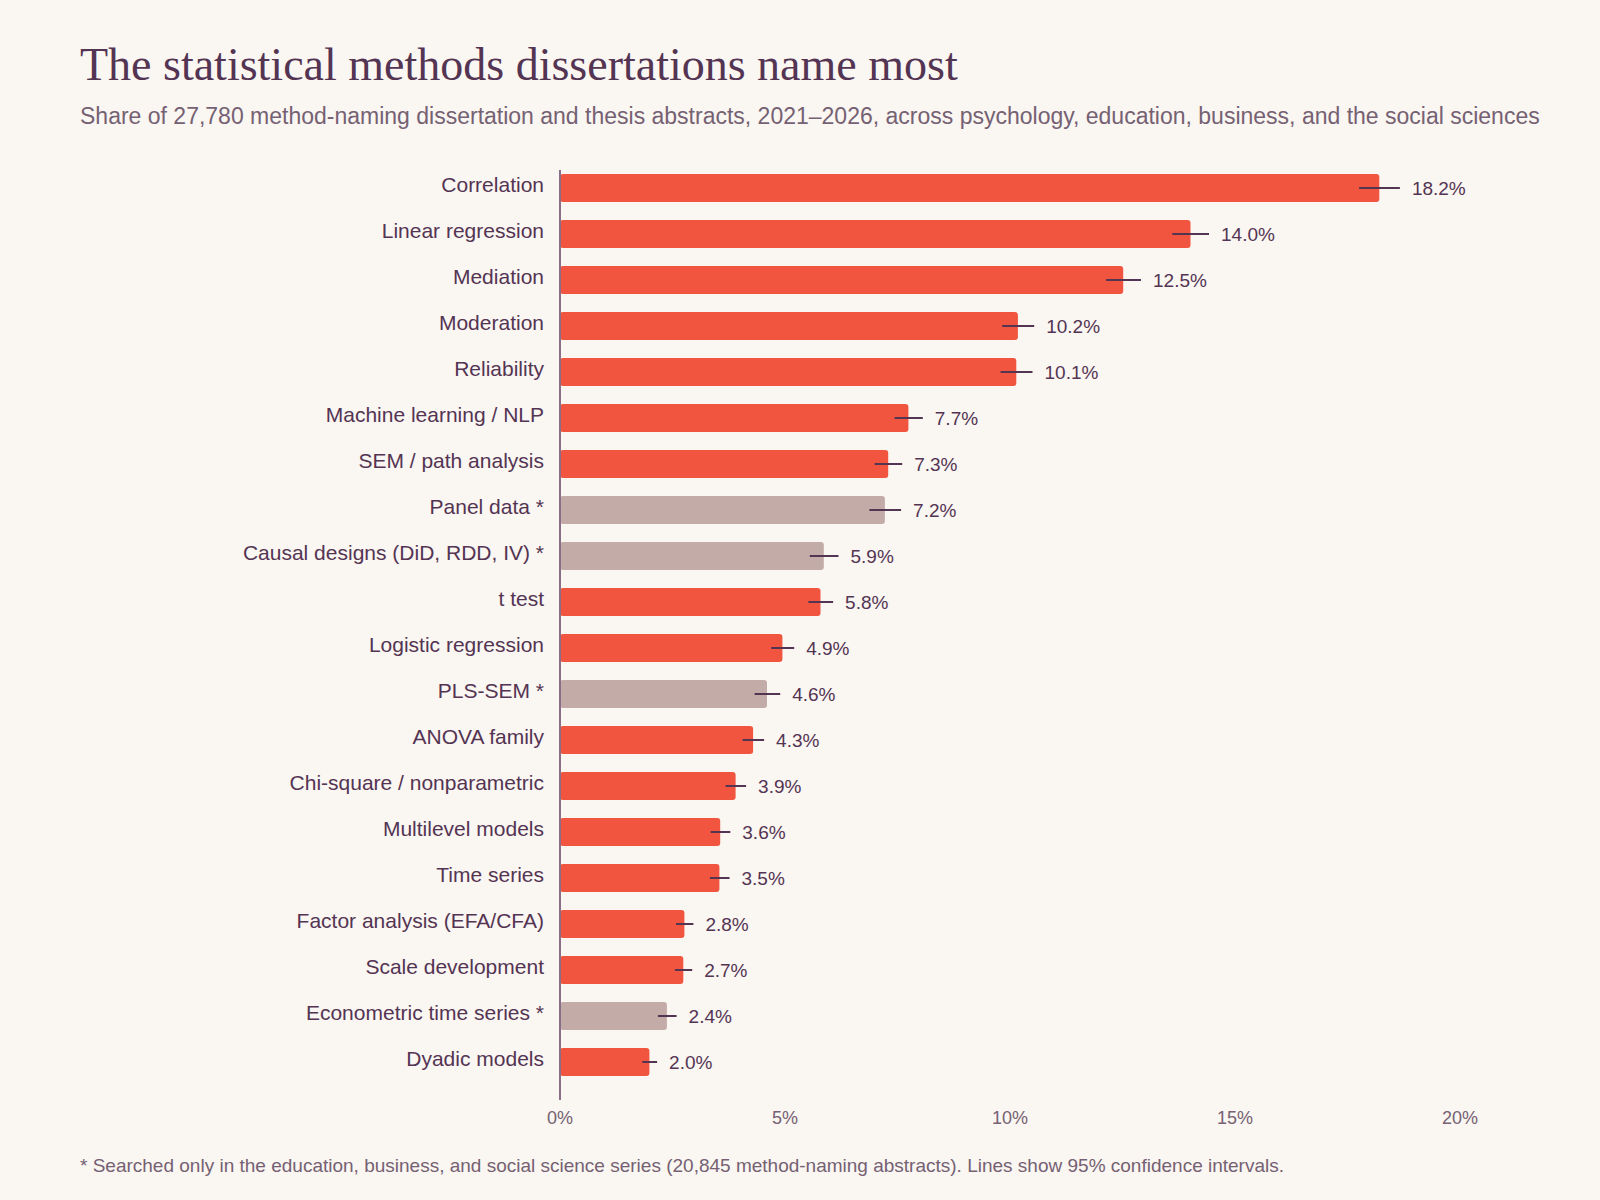
Correlation is the most common method in psychology and the social sciences; t tests lead in education and linear regression in business. Mediation and moderation, questions about how and when one variable relates to another, come next, ahead of every classic group comparison. Reliability is fifth, because dissertations that build or adapt questionnaires report it. Machine learning (7.7%) and SEM (7.3%) round out the top tier, and panel data and causal designs such as difference-in-differences are common wherever economists and accounting researchers are in the mix.
Methods that committees ask about constantly are rare in abstracts: multilevel models (3.6%), factor analysis (2.8%), latent profile analysis (1.2%), and propensity scores (0.8%). Some of that reflects what fits in an abstract, but it also suggests nested data and measurement are often handled more simply than they could be.
Each field has its own fingerprint
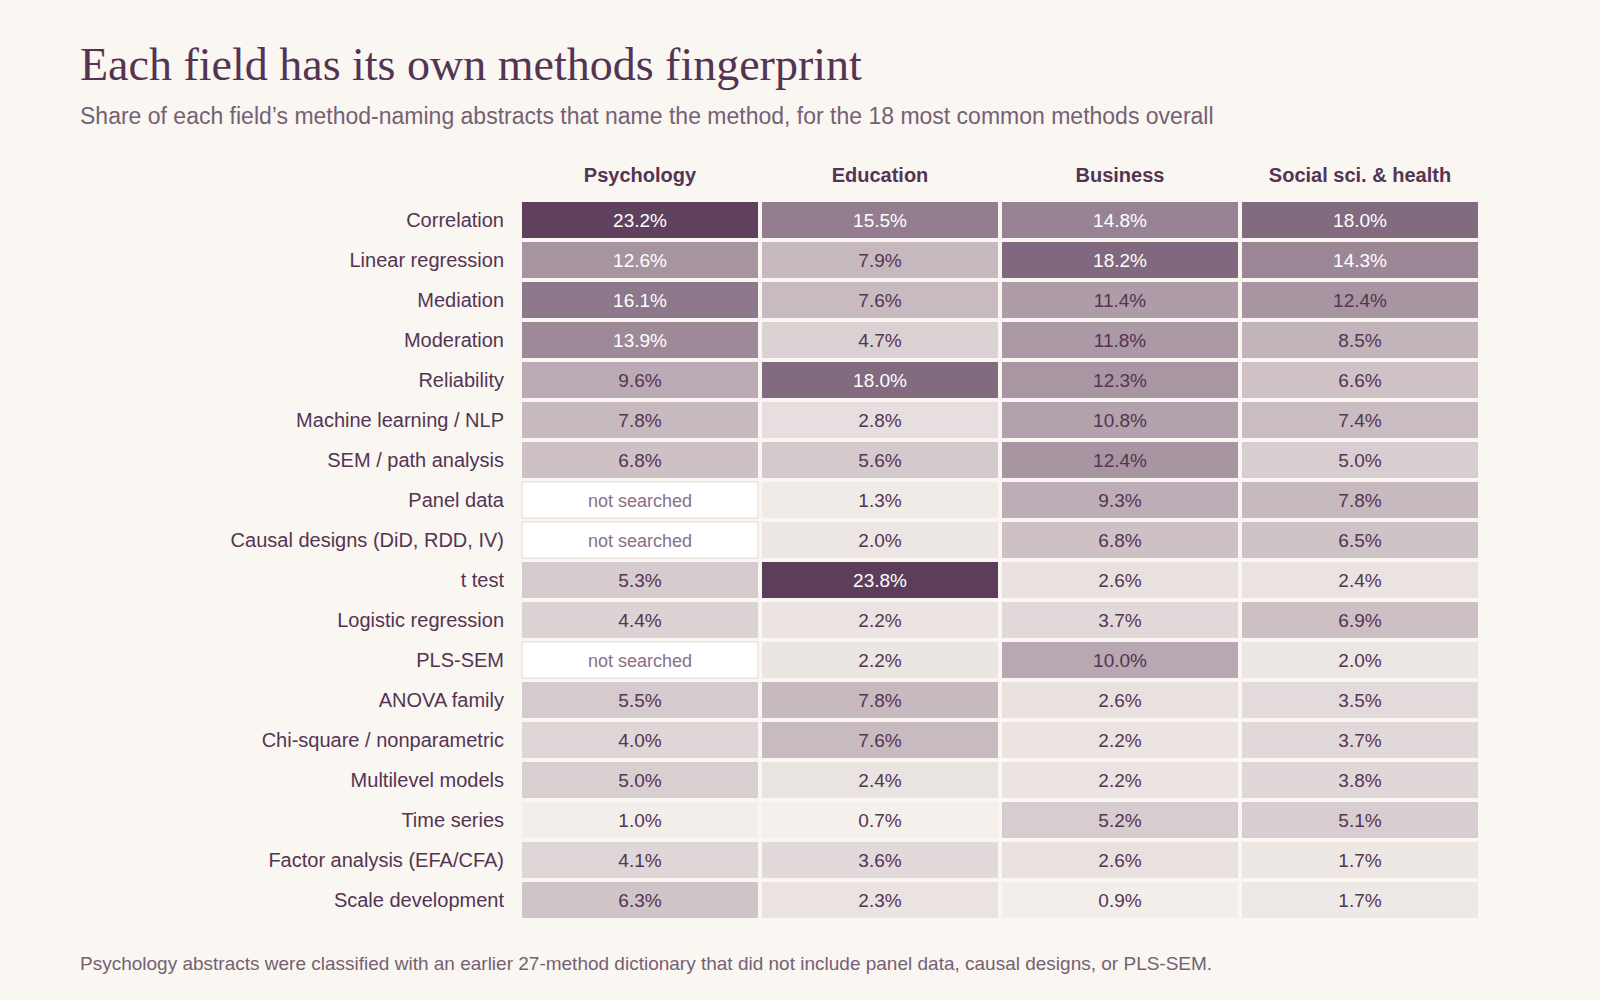
- Psychology is the field of explanatory survey models: correlation (23%), mediation (16%), moderation (14%), and more multilevel (5%) and dyadic (5%) models than anywhere else.
- Education is the field of comparisons: t tests (24%, about ten times the rate in business and social science), reliability (18%), ANOVA (8%), and chi-square (8%). Much of this comes from international teaching-and-learning studies; in our education series, US-tagged abstracts named t tests far less often.
- Business is the field of models: linear regression (18%), SEM (12%), machine learning (11%), PLS-SEM (10%), and panel data (9%).
- The social sciences and health are the most varied: correlation and regression lead, logistic regression (7%) is more common than elsewhere because health outcomes are often yes-or-no, and economics brings panel data (8%) and causal designs (7%).
The field-by-field posts break these down further, for example clinical psychology, teaching and learning, marketing, and economics.
What changed since 2021
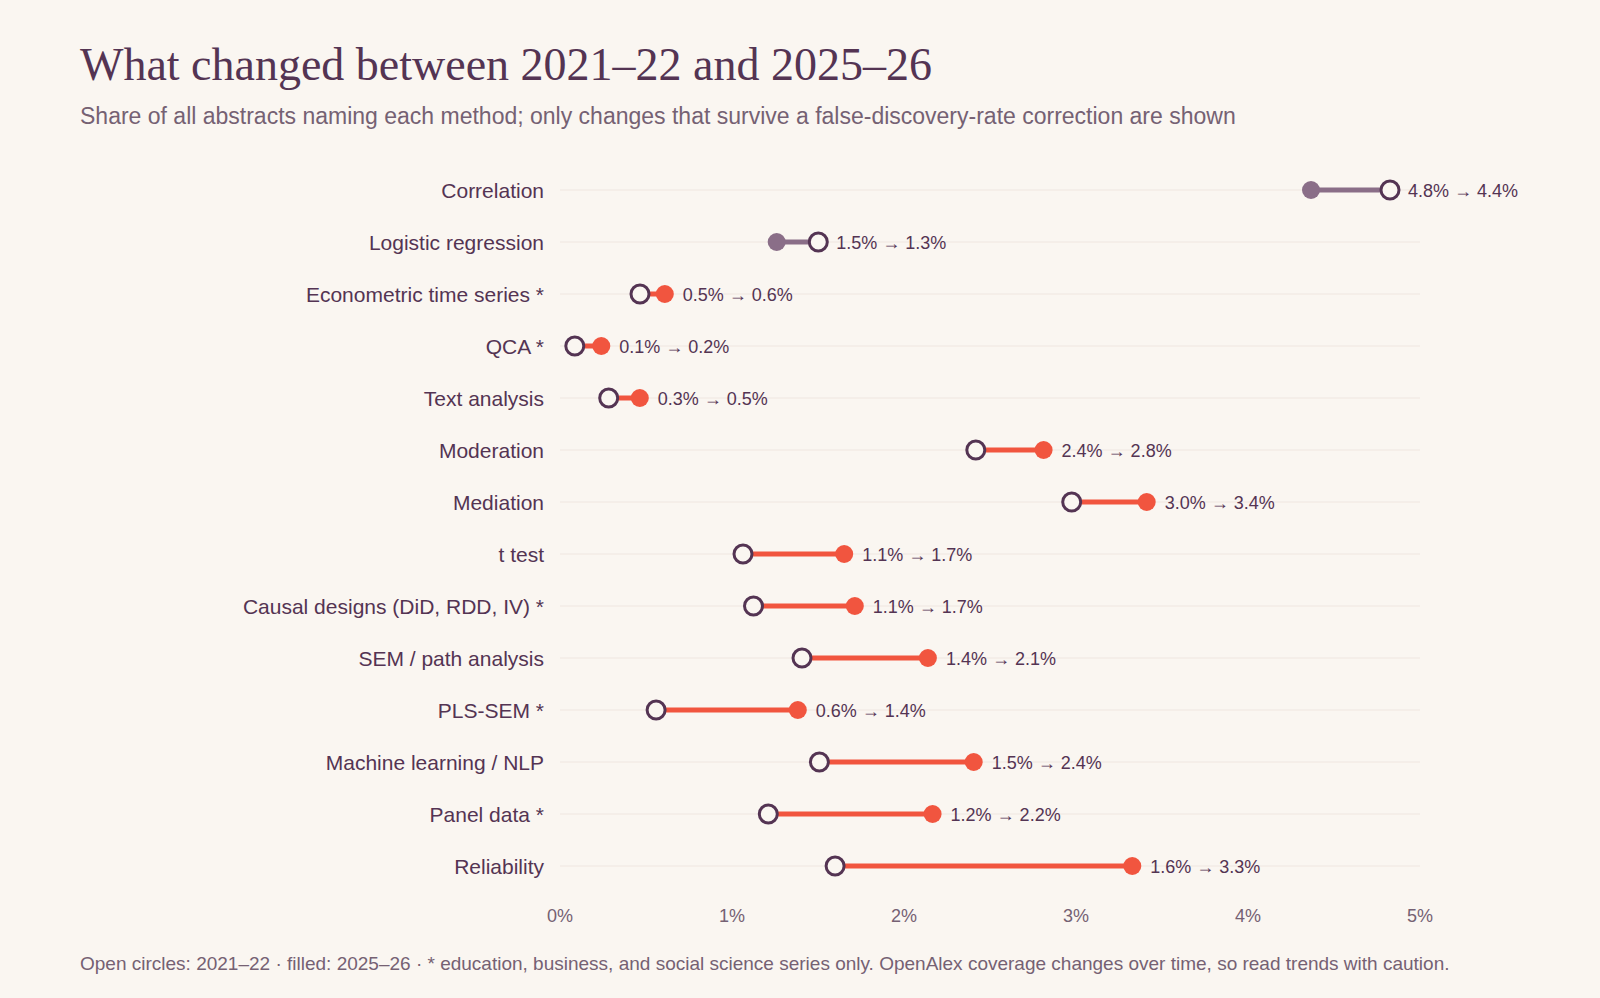
Comparing 2021–22 with 2025–26, the share of all abstracts that report reliability roughly doubled (1.6% to 3.3%), and machine learning, SEM, PLS-SEM, panel data, and causal designs all rose. Correlation and logistic regression fell slightly. These changes survive a correction for testing 36 methods at once.
Read them with caution. OpenAlex indexed more dissertations from 2025–26 (48,899) than from 2021–22 (31,767), and the mix of repositories it covers changes over time. Because methods such as t tests, reliability, and PLS-SEM appear far more often in abstracts from outside the US, a shift in which dissertations are indexed could produce part of these rises without any change in how dissertations are written.
What this means for your dissertation
- Your committee has seen many correlations, regressions, and mediation models. Using a common method is not a weakness, but reporting it completely is what stands out: effect sizes, confidence intervals, and assumptions. Our results chapter guide covers what to report.
- Justify your sample size. With a power analysis in 14 of 27,780 method-naming abstracts, a clear sample-size justification sets a proposal apart. Our power analysis guide and calculators can help.
- Match the method to the data structure, not the field's habit. If your data are nested, repeated, or measured with multi-item scales, the methods that fit, such as multilevel models or SEM, may be less common in your field but more defensible.
- Report missing data. Only 88 method-naming abstracts mention how missing data were handled. Your method chapter should say.
How we did this
We pooled the result tables from our four series, each built from OpenAlex records of English-language works typed as dissertations or theses, with abstracts, published from 2021 through September 2026: psychology (21,308 abstracts), education (18,617), business (22,179), and the social sciences and health (50,799). Each title and abstract was classified with a keyword dictionary of statistical methods. A percentage is the share of method-naming abstracts that mention a method, not how often it was used; keyword matching misses methods described in other words, and abstracts leave out much of what a dissertation does.
The psychology series was classified with an earlier 27-method dictionary. Nine methods (panel data, causal designs, PLS-SEM, econometric time series, spatial analysis, conjoint analysis, propensity scores, QCA, and efficiency analysis) were searched only in the other three series, so their shares use those series' 20,845 method-naming abstracts. Intervals are 95% Wilson intervals. Changes compare the share of all abstracts in 2021–22 with 2025–26 using two-proportion tests with a Benjamini–Hochberg correction across the 36 methods. The data are international, include master's theses, and cover a set of OpenAlex subfields rather than every dissertation. The series code and result tables are on GitHub, and the pooling script and the pooled table are published with this site.
How to cite this benchmark
Yel, N. (2026, September 27). The most common statistical methods in dissertations, 2021–2026: A benchmark from 112,903 abstracts. Dissertation Stats Helper. https://dissertationstatshelper.com/blog/statistical-methods-in-dissertations-benchmark
The pooled table is released under the Creative Commons Attribution 4.0 International (CC BY 4.0) license: you may share and adapt it for any purpose, including commercially, as long as you credit this page. The underlying OpenAlex data are CC0.