
- of abstracts naming a t test report an effect size
- 9%
- of abstracts naming mediation do
- 4%
- of abstracts naming a t test report a CI
- 1%
The results chapter is where a dissertation stops arguing and starts reporting. Committees read it to answer one question: did you test what you said you would test, and what did you find? A good results chapter makes that easy: it follows your research questions in order, reports every planned analysis with enough numbers to check it, and saves interpretation for the discussion.
This guide covers what APA's reporting standards ask a results section to include, a structure that works for most quantitative dissertations, how to format statistics in APA 7, example write-ups for common tests, and the mistakes committees flag most.
Report here, interpret later
The results chapter describes what the data show. It does not explain why, compare findings with other studies, or discuss implications; those belong in the discussion chapter. A useful test for every sentence: could a reader who disagrees with your theory still agree that this sentence is true? If not, move it to the discussion. Write in past tense, and follow the same order as your research questions and your method chapter.
What APA's reporting standards ask for
APA's Journal Article Reporting Standards for quantitative research (JARS–Quant Table 1) list what a results section should report. In a dissertation, some of this sits in the method chapter, but all of it should be somewhere:
- Participant flow: how many people you had at each stage (recruited, eligible, enrolled, completed, analyzed), ideally with a flowchart, and the dates of recruitment and follow-up.
- Missing data: how much was missing, what you know about why (missing completely at random, at random, or not at random), and how you handled it.
- Descriptive statistics: for each primary and secondary outcome, the number of cases, means, and standard deviations, for the full sample and each subgroup.
- Inferential statistics: for every test you ran, the exact p value (if you use significance testing), the statistics needed to reconstruct the test (such as the test statistic and its degrees of freedom), and an effect size with a confidence interval wherever possible.
- Primary, secondary, and exploratory analyses, clearly separated.
- For complex models (multilevel, SEM, factor analysis): the model details, the correlation or covariance matrix, and the software used.
- Problems: estimation problems, diagnostics, and any violated assumptions that could affect the findings.
A structure that works
- Data screening and preliminary analyses. Final sample and participant flow, missing data and how you handled it, outliers, and assumption checks.
- Descriptive statistics. Means, standard deviations, and correlations for your study variables, usually in Table 1, plus reliability for each scale in your sample.
- Results by research question. For each question or hypothesis: restate it in one sentence, name the analysis, report the numbers, and say whether the result supports the hypothesis, without explaining why.
- Additional analyses. Sensitivity checks and exploratory analyses, labeled as such.
- Summary. A short paragraph listing what was and wasn't supported, as a bridge to the discussion.
Formatting statistics in APA 7
The rules below come from APA's Numbers and Statistics Guide (Publication Manual, 7th ed., sections 6.36 and 6.40–6.45):
- Italicize statistical symbols such as M, SD, t, F, p, r, n, and N, but not Greek letters such as β, χ², or ω².
- Leading zeros: write 0.45 for statistics that can exceed 1 (such as Cohen's d), but .45 for those that can't (correlations, proportions, p values).
- Decimals: in general, two decimals for most statistics, and one decimal for means and standard deviations of integer-scale data such as Likert items. Round as much as precision allows.
- p values: report exact values to two or three decimals (p = .03, p = .006), and p < .001 for smaller values. Never write p = .000.
- Spacing: put spaces around operators (M = 7.7), and don't repeat the same statistics in the text and a table.
- Abbreviations: statistical symbols such as M, SD, t, and df need no definition; abbreviations such as ANOVA, CI, and RMSEA should be defined at first use.
Example write-ups
These use made-up numbers, but each set is internally consistent, so you can use them as templates. Adapt the wording to your own variables.
Independent-samples t test. Students in the mentoring group reported higher academic self-efficacy on a 5-point scale (M = 4.1, SD = 0.6) than students in the comparison group (M = 3.8, SD = 0.7), Welch's t(196.8) = 3.12, p = .002, Hedges' g = 0.44, 95% CI [0.16, 0.72].
One-way ANOVA. Burnout differed across school levels, F(2, 297) = 5.84, p = .003, ω² = .03. Tukey comparisons showed higher burnout among high school teachers than elementary teachers (mean difference = 0.31, p = .006).
Correlation. Workload was positively correlated with burnout, r(298) = .42, 95% CI [.32, .51], p < .001.
Multiple regression. Together, workload and principal support explained 24% of the variance in burnout, R² = .24, F(2, 297) = 46.89, p < .001. Higher workload predicted higher burnout (b = 0.38, 95% CI [0.28, 0.48], β = .39), and more principal support predicted lower burnout (b = −0.22, 95% CI [−0.32, −0.12], β = −.23), both p < .001.
Chi-square test. Intent to stay differed by school level, χ²(2, N = 300) = 8.47, p = .014, Cramér's V = .17.
Logistic regression. Each additional year of teaching experience was associated with higher odds of intending to stay, OR = 1.06, 95% CI [1.02, 1.10], p = .003.
Mediation. The indirect effect of transformational leadership on engagement through psychological safety was positive, ab = 0.14, 95% bootstrap CI [0.07, 0.22], based on 5,000 resamples.
If you already have the output and just need the sentence, our free APA results formatters turn test statistics into APA-style text, and the p-value checker recomputes a p value from a reported statistic.
Tables and figures
Put numbers that readers will compare across rows in a table, and keep the text for the one or two numbers that answer each question. Most quantitative dissertations need at least a descriptive statistics and correlations table and a table for each main model. Number tables in the order you mention them, give each an informative title, and use notes to define abbreviations and give significance levels. APA's sample tables show the format.
What real abstracts report
Abstracts are a rough mirror of how results get summarized. Across 112,903 recent dissertation and thesis abstracts, even those that name a specific test rarely report its numbers:
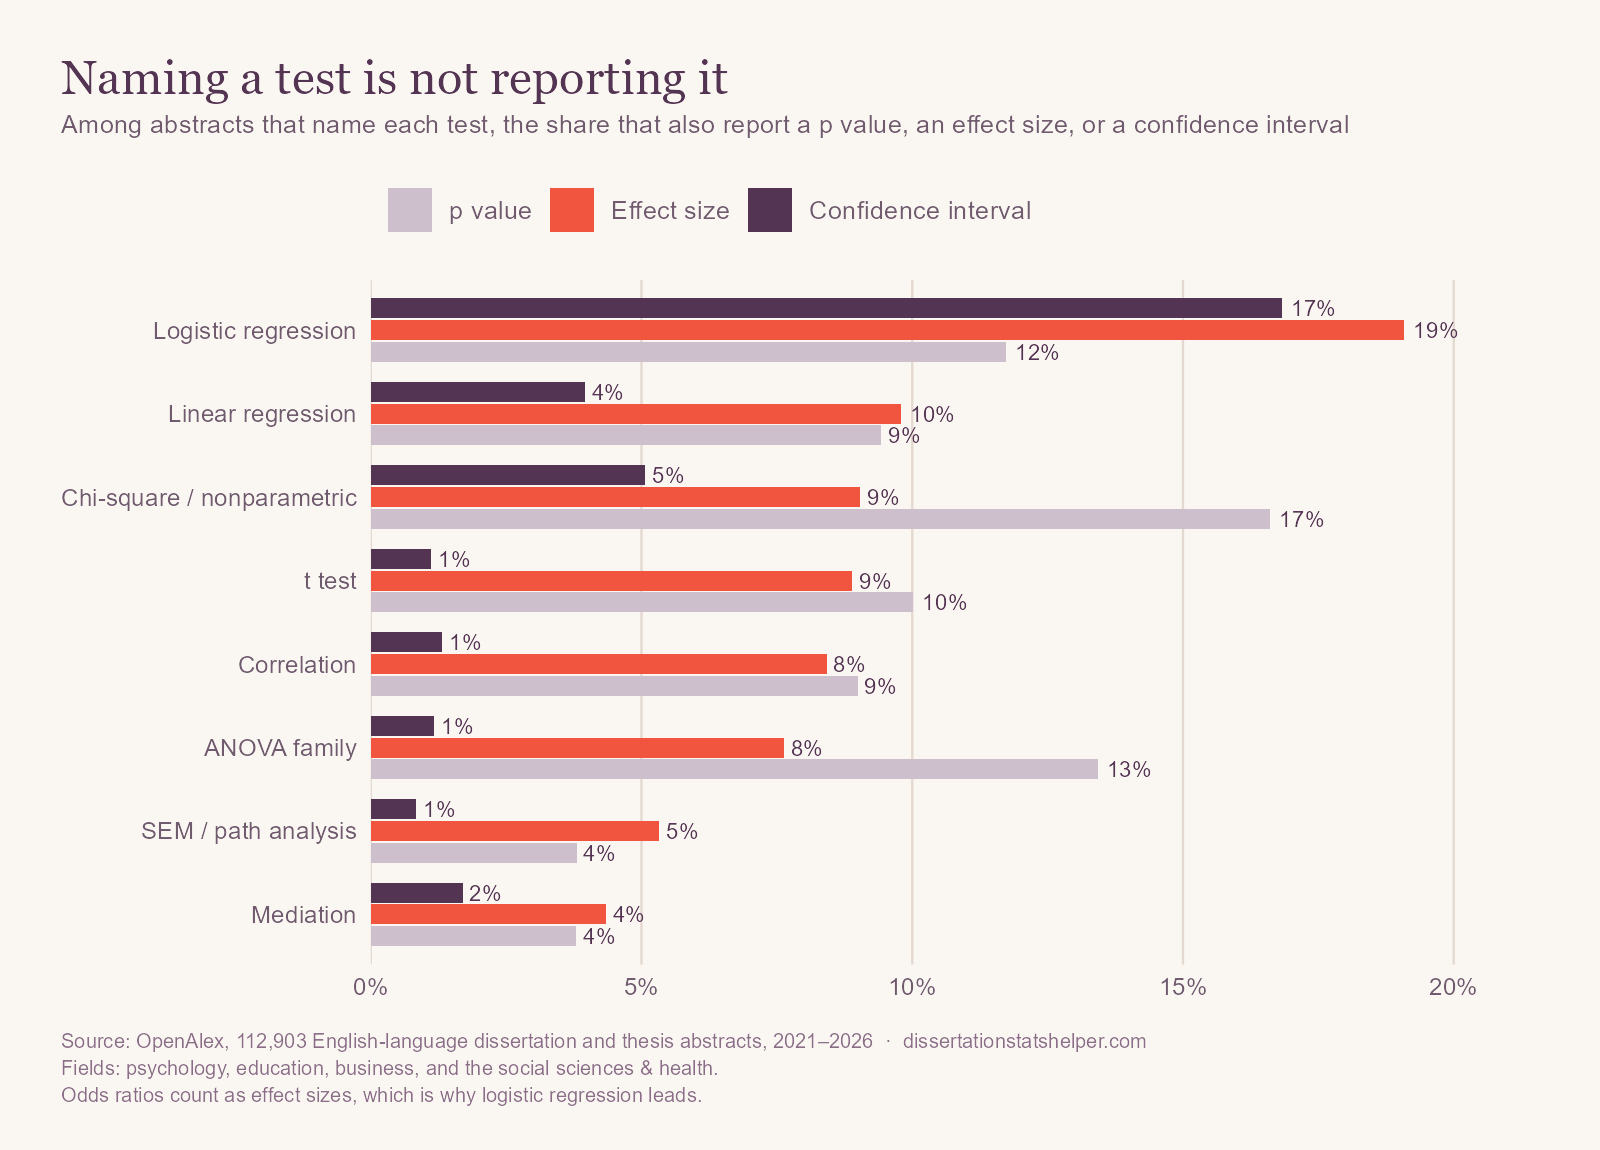
Abstracts that name a t test report an effect size 9% of the time and a confidence interval 1% of the time. Mediation and SEM abstracts, where the key result is often an indirect effect or a path, report the fewest numbers of all. Logistic regression is the exception, because the odds ratio is both the result and the effect size. The lesson for the results chapter: the effect size and its interval are the result. The p value only says whether the result is distinguishable from zero.
Common mistakes
- Interpreting in the results. “This suggests that mentoring builds confidence” belongs in the discussion.
- Only p values. Report the size of every effect with a confidence interval.
- “Marginally significant” or “approaching significance.” Report the exact p value and the effect size, and let the size speak.
- p = .000. Software rounds; write p < .001.
- Pasted software output. Rebuild tables in APA format with only the numbers readers need.
- Missing assumption checks and missing-data handling. Committees ask about both; report them before the main results.
- Every test you ran, in no particular order. Report planned analyses by research question, then label exploratory ones.
- “Proved.” Results support or fail to support a hypothesis; they don't prove it.
Checklist
- Final sample size and participant flow reported
- Missing data: amount, likely mechanism, and handling
- Assumption checks and their results
- Descriptive statistics and correlations table, with reliability for each scale
- Each research question restated and answered in order
- Every test: statistic, degrees of freedom, exact p, effect size, and confidence interval
- Primary, secondary, and exploratory analyses clearly labeled
- APA formatting: italics, leading zeros, decimals, p < .001
- Tables numbered in order, no numbers repeated in text and tables
- No interpretation; past tense throughout
How we did this
The guidance summarizes APA's JARS–Quant Table 1 and the APA Style Numbers and Statistics Guide. Your graduate school's template and your committee's preferences come first. The data come from the same 112,903 OpenAlex dissertation and thesis abstracts as our abstract guide. For each test, we took the abstracts that name it and searched them for a p value (such as “p < .05”), an effect size (such as Cohen's d, an odds ratio, or “effect size”), and a confidence interval. Keyword matching misses results phrased in other ways, so the shares are lower bounds. The analysis code and result tables are on GitHub.