
- of method-naming psychology abstracts name multilevel models
- 5%
- in developmental and educational psychology
- 4%
- in organizational behavior and HRM
- 3%
Many dissertation datasets are nested: students within classrooms and schools, employees within teams, patients within clinics, or repeated measurements within people. Observations in the same group tend to be more alike than observations in different groups, so they are not independent, and ordinary regression, which assumes they are, reports standard errors that are too small. Multilevel models handle this, and they let you ask questions ordinary regression can't, such as whether a relationship differs across schools and why.
Yet in our analysis of recent abstracts, multilevel models appear in only 5% of method-naming psychology abstracts, 4% in developmental and educational psychology, and 3% in organizational behavior and HRM, fields where nested data are common. This guide covers when you need a multilevel model, how to build one step by step, the decisions committees ask about, example syntax, and how to report it in APA 7.
What a multilevel model does
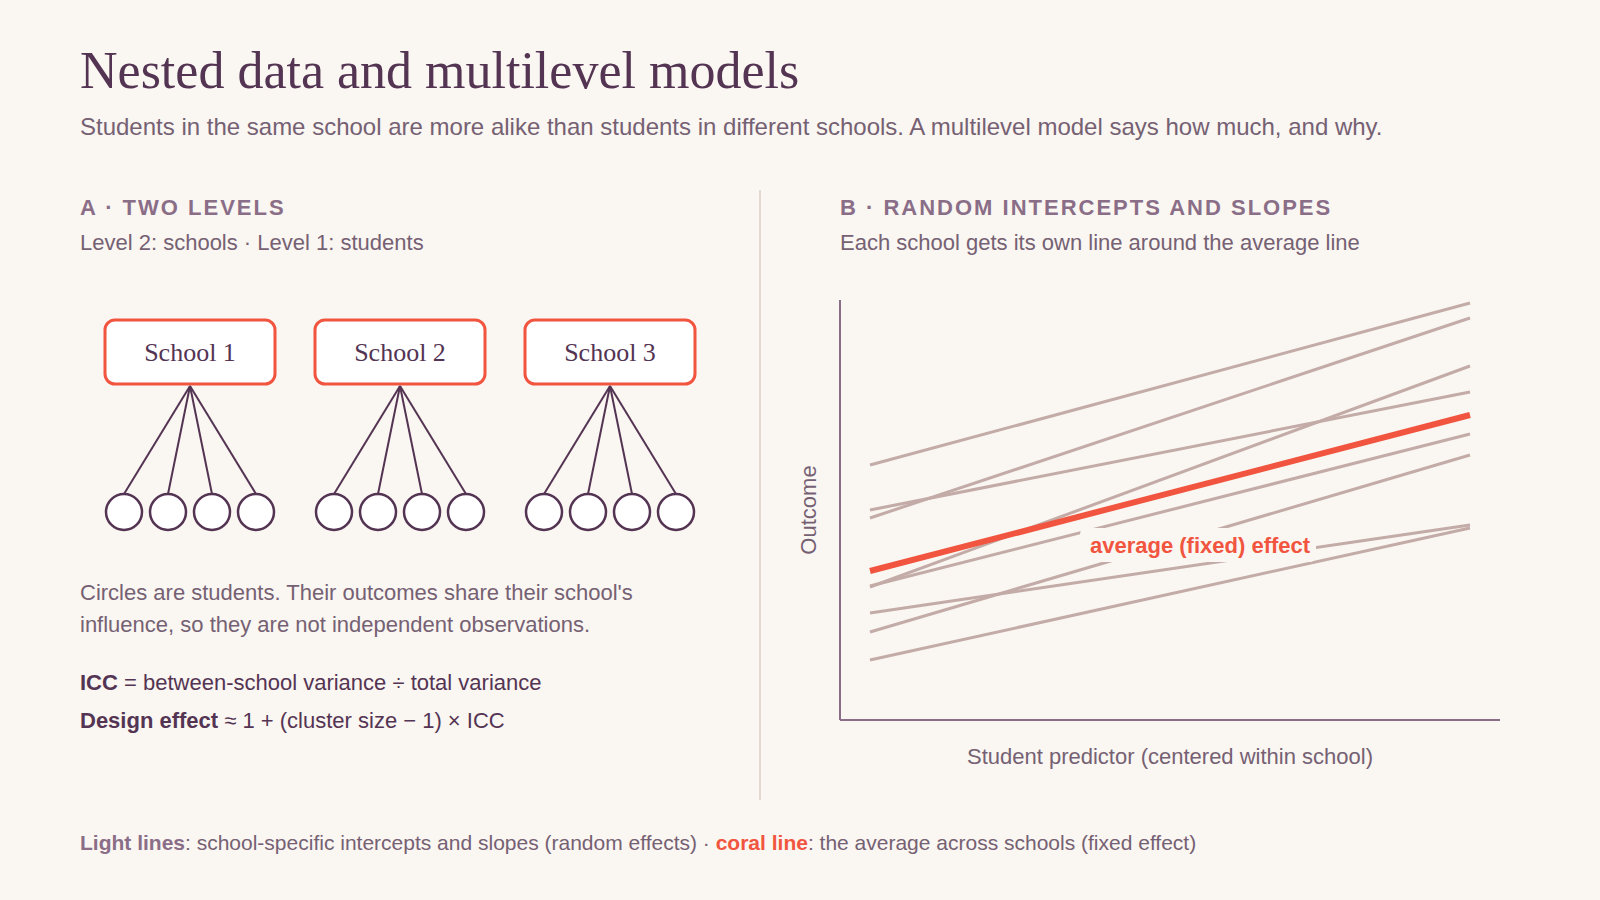
Multilevel models, hierarchical linear models (HLM), linear mixed-effects models, and random-effects models are the same family of models under different names. HLM is also the name of a software program and of Raudenbush and Bryk's (2002) textbook. The model splits variation in the outcome into parts: variation between groups (level 2) and variation within groups (level 1). It estimates:
- Fixed effects: the average intercept and slopes across groups. These are the coefficients you interpret like regression coefficients.
- Random effects: how much groups vary around those averages, reported as variances. A random intercept lets each group have its own average; a random slope lets a predictor's effect differ across groups.
Do you need one?
Start with the intraclass correlation (ICC): the share of the outcome's variance that lies between groups. With an ICC of .10, 10% of the variation is between schools. How much the nesting matters depends on both the ICC and the group size, which the design effect summarizes: approximately 1 + (average cluster size − 1) × ICC. With 25 students per class and an ICC of .10, the design effect is 3.4, so ordinary regression would treat the data as if they held more than three times as much information as they do.
Even a small ICC matters when groups are large, and a multilevel model is also the right choice whenever your questions involve group-level predictors, such as school climate or team leadership, or differences in relationships across groups.
Building the model step by step
- The null model. Fit the outcome with only a random intercept for groups. Report the between-group variance, the within-group variance, and the ICC.
- Level-1 predictors. Add student-level (or employee-level, or day-level) predictors, centered as described below.
- Level-2 predictors. Add group-level predictors, including the group means of your level-1 predictors if you want between-group effects.
- Random slopes. Allow a level-1 slope to vary across groups if theory says it should, and test whether that improves the model.
- Cross-level interactions. Test whether a level-2 variable explains why a level-1 slope differs across groups, for example whether school climate weakens the link between family income and achievement.
Present the models side by side in one table, so readers can see how the fixed effects and variance components change as you add terms.
The decisions committees ask about
Centering. How you center level-1 predictors changes what their coefficients mean (Enders & Tofighi, 2007). Centering within cluster (subtracting each group's mean) gives a pure within-group effect: how a student compares with classmates. Adding the group mean as a level-2 predictor gives the between-group effect: how schools with higher average income compare with schools with lower average income. The two often differ, and the difference, the contextual effect, can be a finding in itself. Grand-mean centering gives a blend of the two. Choose centering from your research question and say why.
Number of groups. The number of groups matters more than the number of people per group for estimates about groups. Maas and Hox (2005) found that about 50 groups gave accurate level-2 standard errors, and fewer than 30 groups is often considered small. With few groups, use restricted maximum likelihood (REML) with Kenward–Roger or Satterthwaite degrees of freedom (McNeish & Stapleton, 2016), keep the random-effects structure simple, and be cautious about level-2 conclusions.
Estimation and model comparison. REML gives better variance estimates. To compare models that differ in their fixed effects with a likelihood-ratio test, fit them with full maximum likelihood (ML). Also report AIC or BIC if you compare models that aren't nested.
Random slopes. Add them for predictors whose effects you expect to vary, and always for a level-1 predictor in a cross-level interaction. If a model fails to converge or reports a singular fit, simplify the random effects step by step and report what you removed.
Effect sizes. Report the variance explained at each level, or the marginal and conditional R² (Nakagawa & Schielzeth, 2013): the variance explained by the fixed effects alone, and by the fixed and random effects together.
Running it
In R with lme4 and lmerTest (which adds Satterthwaite degrees of freedom), for students in schools with a student-level predictor (ses) and a school-level predictor (climate):
library(lmerTest)
dat$ses_mean <- ave(dat$ses, dat$school)   # school mean
dat$ses_cwc  <- dat$ses - dat$ses_mean     # centered within school

m0 <- lmer(math ~ 1 + (1 | school), data = dat)
performance::icc(m0)

m1 <- lmer(math ~ ses_cwc + ses_mean + climate + (1 | school), data = dat)
m2 <- lmer(math ~ ses_cwc * climate + ses_mean + (1 + ses_cwc | school), data = dat)
summary(m2)
anova(m1, m2)                 # likelihood-ratio test, refit with ML
performance::r2(m2)           # marginal and conditional R-squared
The same final model with SPSS MIXED:
MIXED math WITH ses_cwc ses_mean climate
  /FIXED = ses_cwc ses_mean climate ses_cwc*climate
  /RANDOM = INTERCEPT ses_cwc | SUBJECT(school) COVTYPE(UN)
  /METHOD = REML
  /PRINT = SOLUTION TESTCOV.
For a binary or count outcome, use a generalized linear mixed model (glmer in R, or GENLINMIXED in SPSS). For repeated measures, time or day is the level-1 unit and people are level 2; our growth modeling and daily diary workflows cover those designs.
Reporting it in APA 7
Report the data structure (the number of units at each level and the range of group sizes), the ICC, centering choices, the estimator and degrees-of-freedom method, missing-data handling, and, for each model, the fixed effects with standard errors or confidence intervals, the variance components, and model comparisons. These made-up numbers are internally consistent, so you can use them as a template:
The data included 1,840 students in 72 schools (12 to 41 students per school, M = 25.6). We fit two-level models in lme4 (Bates, Mächler, Bolker, & Walker, 2015) with REML and Satterthwaite degrees of freedom. In the null model, the between-school variance was 18.4 and the within-school variance was 81.2, so 18% of the variance in math achievement lay between schools (ICC = .18; design effect ≈ 5.5).
Student SES was centered within school, and the school mean of SES was entered at level 2. Within schools, students with higher SES scored higher, b = 2.10, SE = 0.24, 95% CI [1.63, 2.57], p < .001. Between schools, a one-unit higher school-mean SES was associated with 4.85 points higher achievement, SE = 0.92, 95% CI [3.02, 6.69], p < .001, a contextual effect of 2.75 points beyond the within-school effect. Schools with a more positive climate had higher achievement, b = 1.30, SE = 0.55, 95% CI [0.20, 2.40], p = .021, and a weaker association between SES and achievement, cross-level interaction b = −0.62, SE = 0.21, 95% CI [−1.04, −0.20], p = .004. The final model explained 19% of the variance through fixed effects (marginal R² = .19) and 31% with random effects included (conditional R² = .31).
A table with one column per model, listing fixed effects, variance components, and fit statistics, is the standard format. Our results chapter guide covers the general APA 7 formatting rules.
Questions committees ask
“The ICC is small. Do you really need a multilevel model?” Point to the design effect, which depends on group size too, and to any group-level predictors or cross-level questions, which require the multilevel structure regardless of the ICC.
“Why not ordinary regression with cluster-robust standard errors?” That fixes the standard errors and is reasonable if you only care about level-1 effects. A multilevel model also estimates how groups vary and lets you explain that variation, which is usually part of the research question.
“Why not group fixed effects (dummy variables for each school)?” Fixed effects control for everything stable about each group, which is a strength when you only want within-group effects, but they can't estimate the effects of group-level predictors. Say which question you are answering.
“How did you center, and why?” Explain which effect each coefficient represents, within, between, or a blend, and tie the choice to the research question.
“Do you have enough groups?” Report the number of groups, the estimation and degrees-of-freedom method, and a power analysis or simulation if you planned one. Be modest about level-2 effects when groups are few.
“Why this random-effects structure?” Justify random slopes from theory, report the tests of added variance components, and report any simplification made to reach convergence.
Common mistakes
- Ignoring the nesting, or averaging level-1 data to the group level and losing the within-group information.
- No null model and no ICC.
- Uncentered or unexplained centering, leaving within and between effects mixed together.
- Cross-level interactions without a random slope for the level-1 predictor.
- Too few groups for the level-2 conclusions drawn, or complex random effects with few groups.
- Comparing fixed-effect models fitted with REML using a likelihood-ratio test.
- Reporting only fixed effects, without the variance components.
- Treating one-per-group measures, such as a principal's rating, as if each student supplied an independent observation.
Checklist
- Nesting structure described: units at each level and group-size range
- Null model with variance components, ICC, and design effect
- Centering of every level-1 predictor stated and justified
- Level-2 predictors, including group means where relevant
- Random slopes justified and tested; convergence problems reported
- Estimator (REML or ML), degrees-of-freedom method, and software
- Fixed effects with SEs or CIs, and variance components, for each model
- Model comparisons (likelihood-ratio tests with ML, or AIC and BIC)
- Variance explained or marginal and conditional R²
- Number of groups discussed as a limitation if small
How we did this
The guidance draws on Raudenbush and Bryk's Hierarchical Linear Models (2nd ed., Sage, 2002), Snijders and Bosker's Multilevel Analysis (2nd ed., Sage, 2012), and the studies cited above: Enders and Tofighi (2007), Psychological Methods; Maas and Hox (2005), Methodology; McNeish and Stapleton (2016), Educational Psychology Review; Nakagawa and Schielzeth (2013), Methods in Ecology and Evolution; and Bates, Mächler, Bolker, and Walker (2015), Journal of Statistical Software. The shares of abstracts come from our psychology and business methods overviews, built from OpenAlex dissertation and thesis abstracts. The analysis code and result tables are on GitHub.