
- abstracts analyzed
- 2,672
- of method-naming abstracts use mediation
- 28%
- describe a survey
- 26%
Organizational behavior and human resource management studies why people at work think, feel, and act as they do. In our analysis of 22,179 business dissertation and thesis abstracts, it has the most psychology-like toolkit in business.
What is in this sample
The most common topics are job satisfaction, customer service quality and loyalty, management and organizational studies, family business, employer branding and e-HRM, leadership and employee performance, talent management, and AI in HR. Of the 2,672 abstracts, 30% name a quantitative method, 33% describe qualitative work, and 26% describe a survey, the highest survey share in business.
The methods these dissertations name most
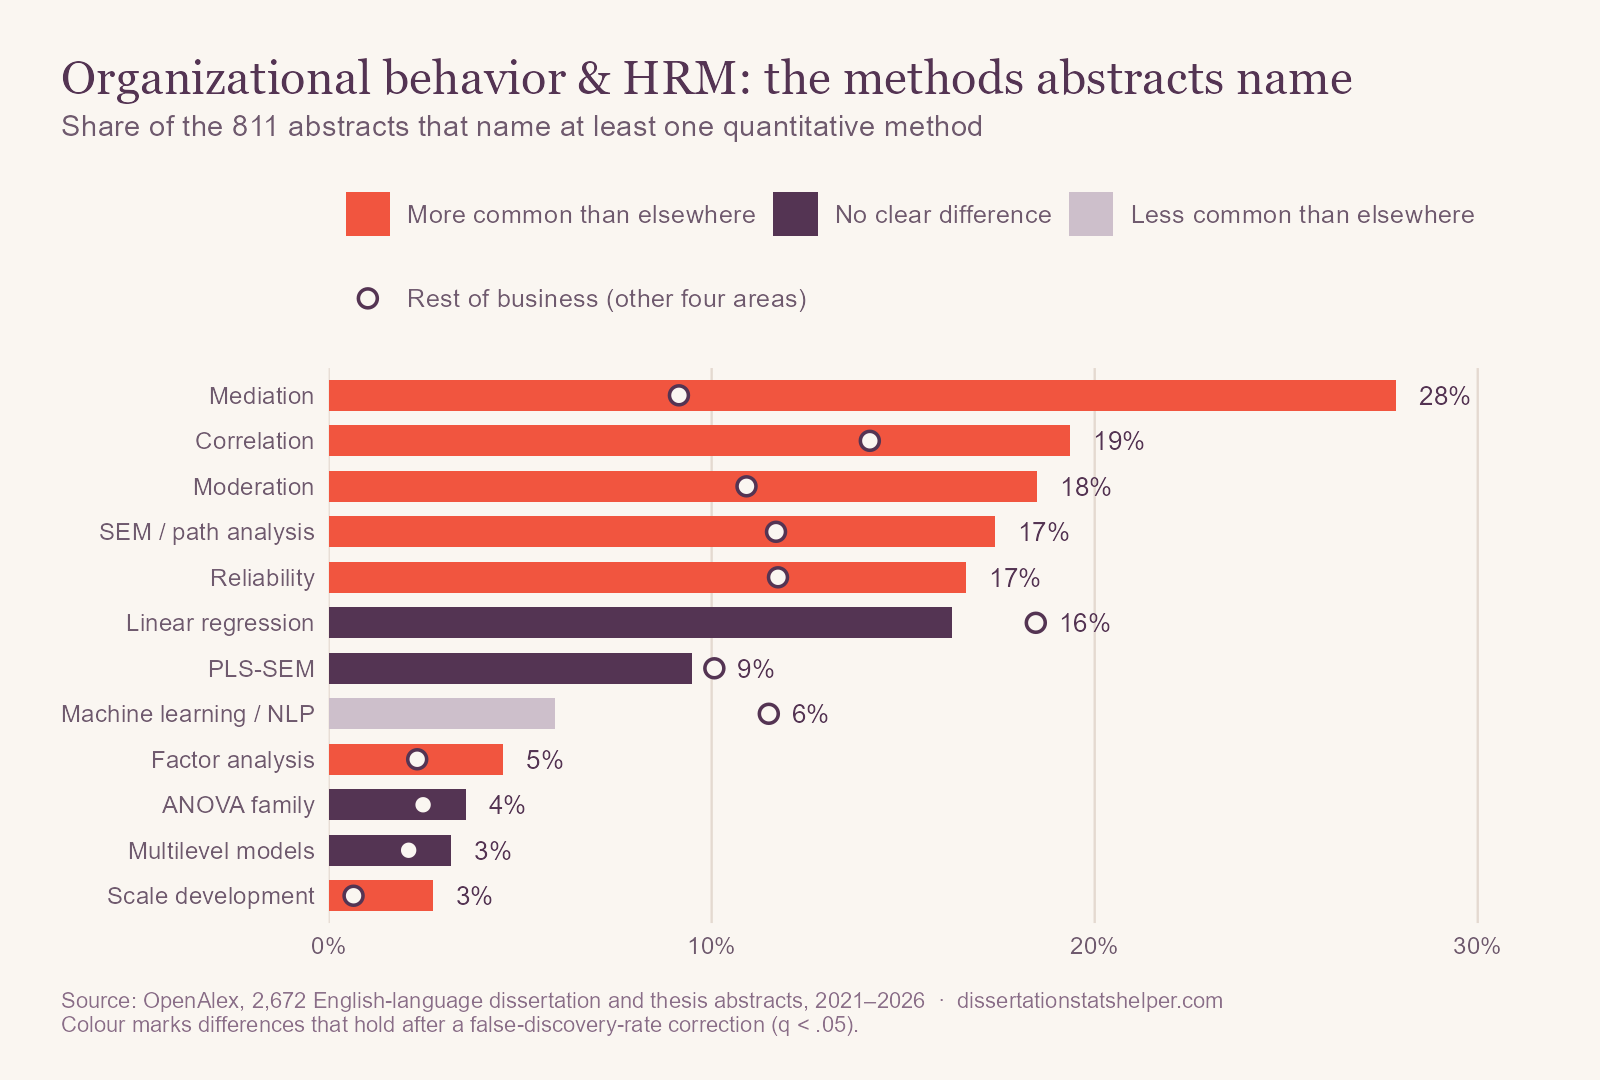
Mediation leads (28% vs. 9% in the rest of business), usually a leadership or HR practice affecting performance through engagement, trust, or satisfaction. Moderation (18% vs. 11%), SEM (17% vs. 12%), correlation (19% vs. 14%), and reliability (17% vs. 12%) are all more common too, along with factor analysis, scale development, and dyadic models of leaders and followers. Econometric methods are nearly absent: panel data (1% vs. 10%) and causal designs (1% vs. 7.5%).
What changed since 2021
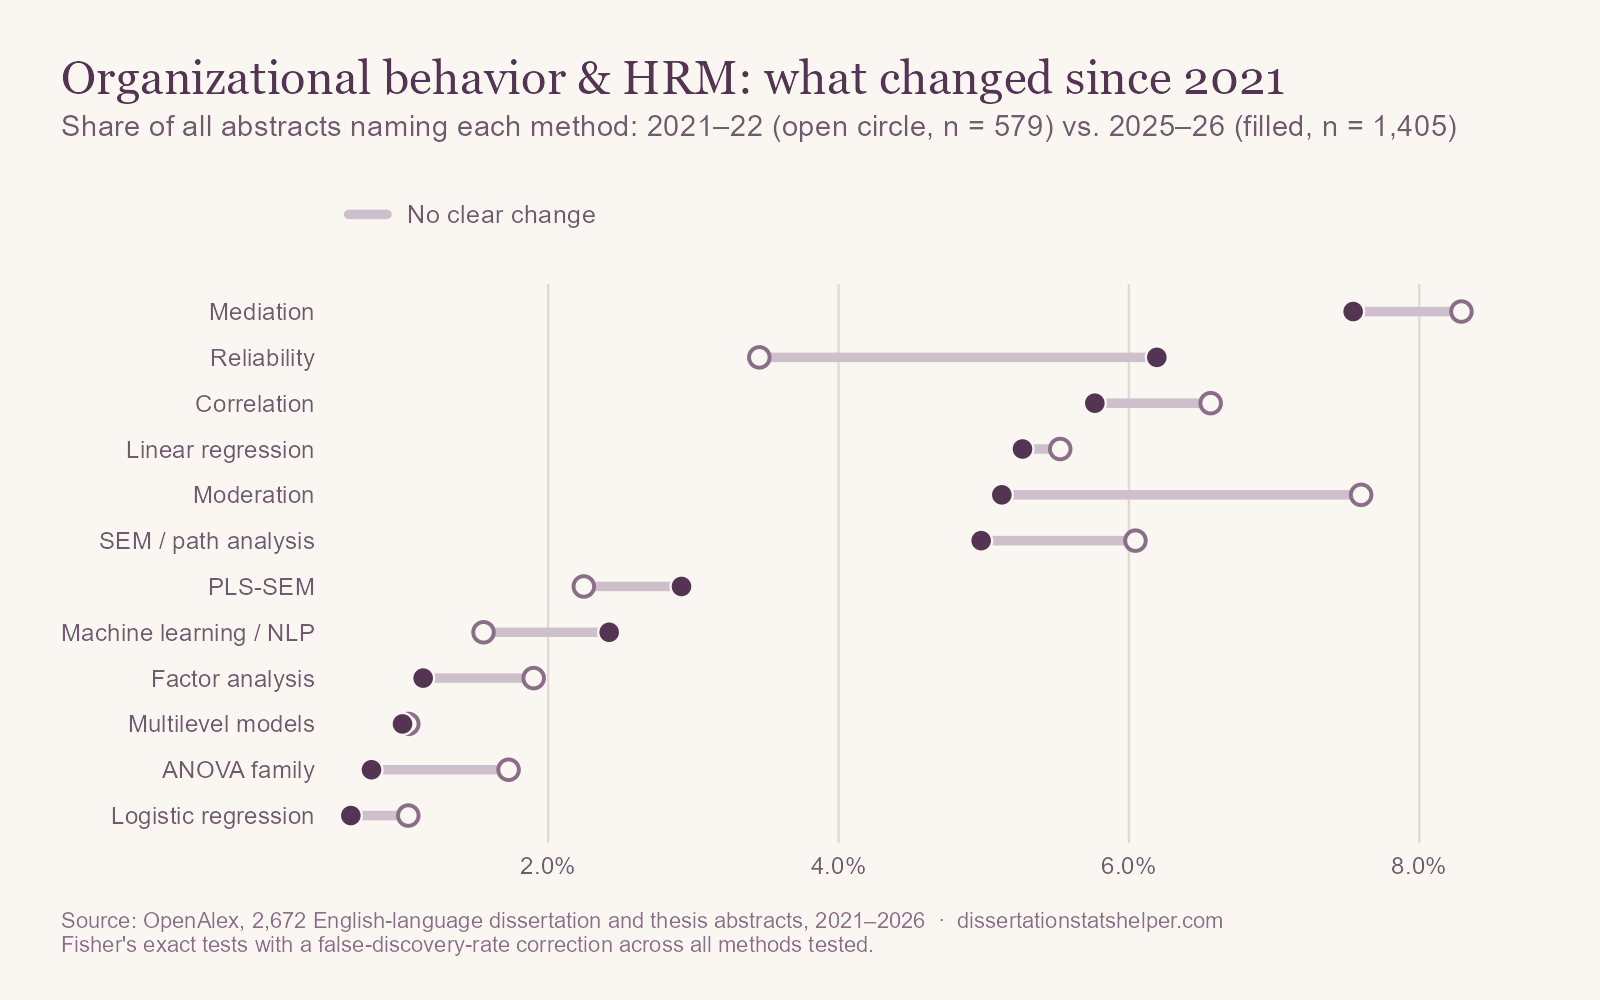
This is the one business area where nothing changed clearly. The share naming a quantitative method held at about 30–32%, and no individual method's rise or fall survives our correction.
What these abstracts leave out
One of 2,672 abstracts mentions a power analysis, and one mentions missing data. Employee surveys often collect data from people nested in teams and supervisors, which matters for both.
If you're planning an organizational behavior or HRM dissertation or thesis
- Separate your measures in time. Measuring leadership, engagement, and performance in one survey inflates every path. Two or three waves, or supervisor-rated outcomes, make mediation far more credible.
- Account for teams. Employees who share a supervisor are not independent. With team data, use a multilevel model, which only 3% of these abstracts name.
- Test your measures. Show that the scales hold up in your sample, and that constructs such as engagement and satisfaction are distinct.
- Probe moderation. Report simple slopes or Johnson–Neyman regions, not only the interaction term.
How we did this
We used OpenAlex, an open index of scholarly works, to collect every English-language dissertation and thesis with an abstract published from 2021 through September 2026 in this area, and searched each title and abstract for about 40 statistical methods, including econometric methods such as panel models and difference-in-differences. The data include master's theses and many works from outside the United States, so “dissertations” here is short for all of them. Percentages describe how often abstracts mention a method, not how often it was used. Comparisons use Fisher's exact tests with a false-discovery-rate correction, and OpenAlex's coverage changes over time, so treat trends with some caution. The overview post has the full method and its limitations. The analysis code and result tables are on GitHub.