
- abstracts analyzed
- 3,866
- of method-naming abstracts use machine learning
- 22%
- are case studies
- 18%
Information systems and technology management covers how organizations adopt, manage, and profit from technology. In our analysis of 22,179 business dissertation and thesis abstracts, it is the only area where machine learning is the most-named method.
What is in this sample
The most common topics are entrepreneurship, big data and business intelligence, quality and supply management, fintech and crowdfunding, business process modeling, IT governance, and enterprise systems. Of the 3,866 abstracts, 21% name a quantitative method, 28% describe qualitative work, and 18% are case studies, the highest case-study share in business.
The methods these dissertations name most
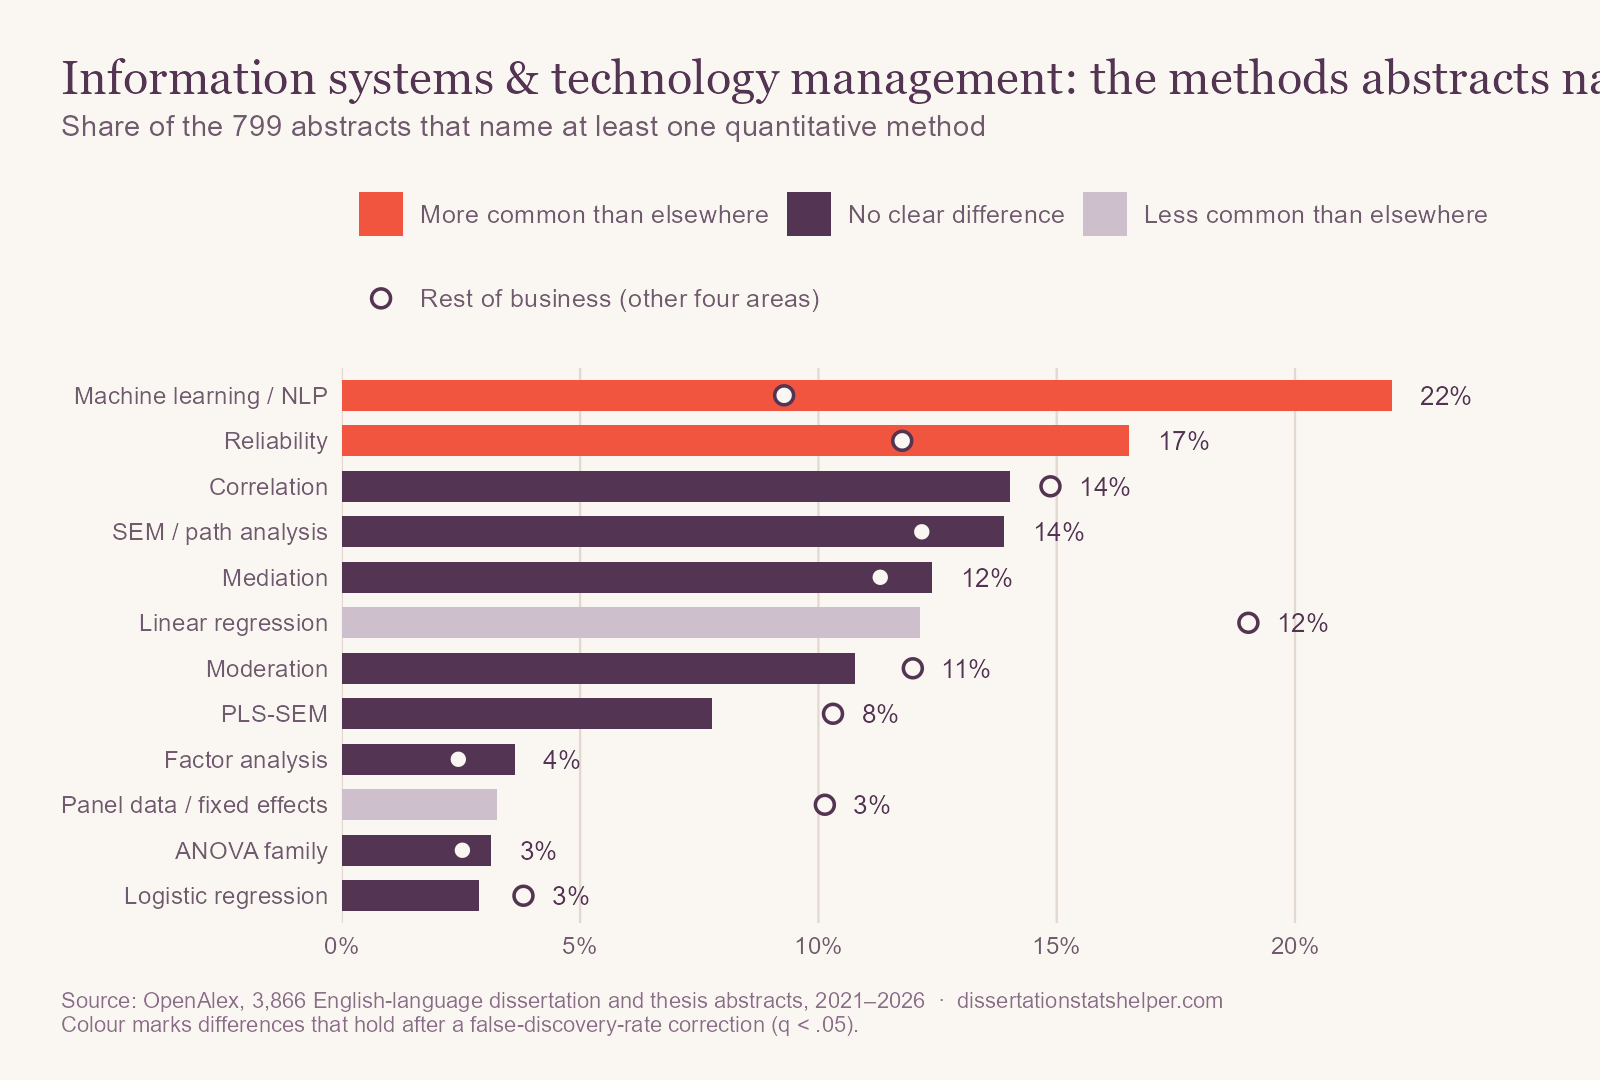
Machine learning appears in 22% of method-naming abstracts, more than twice the rate elsewhere in business (9%): prediction, classification, and text mining on business data. The other side of the area is technology adoption research, with reliability (17% vs. 12%), mediation, and SEM. Network analysis (2% vs. 1%) is small but distinctive. Linear regression (12% vs. 19%) and econometric methods such as panel data (3% vs. 10%) are less common.
What changed since 2021
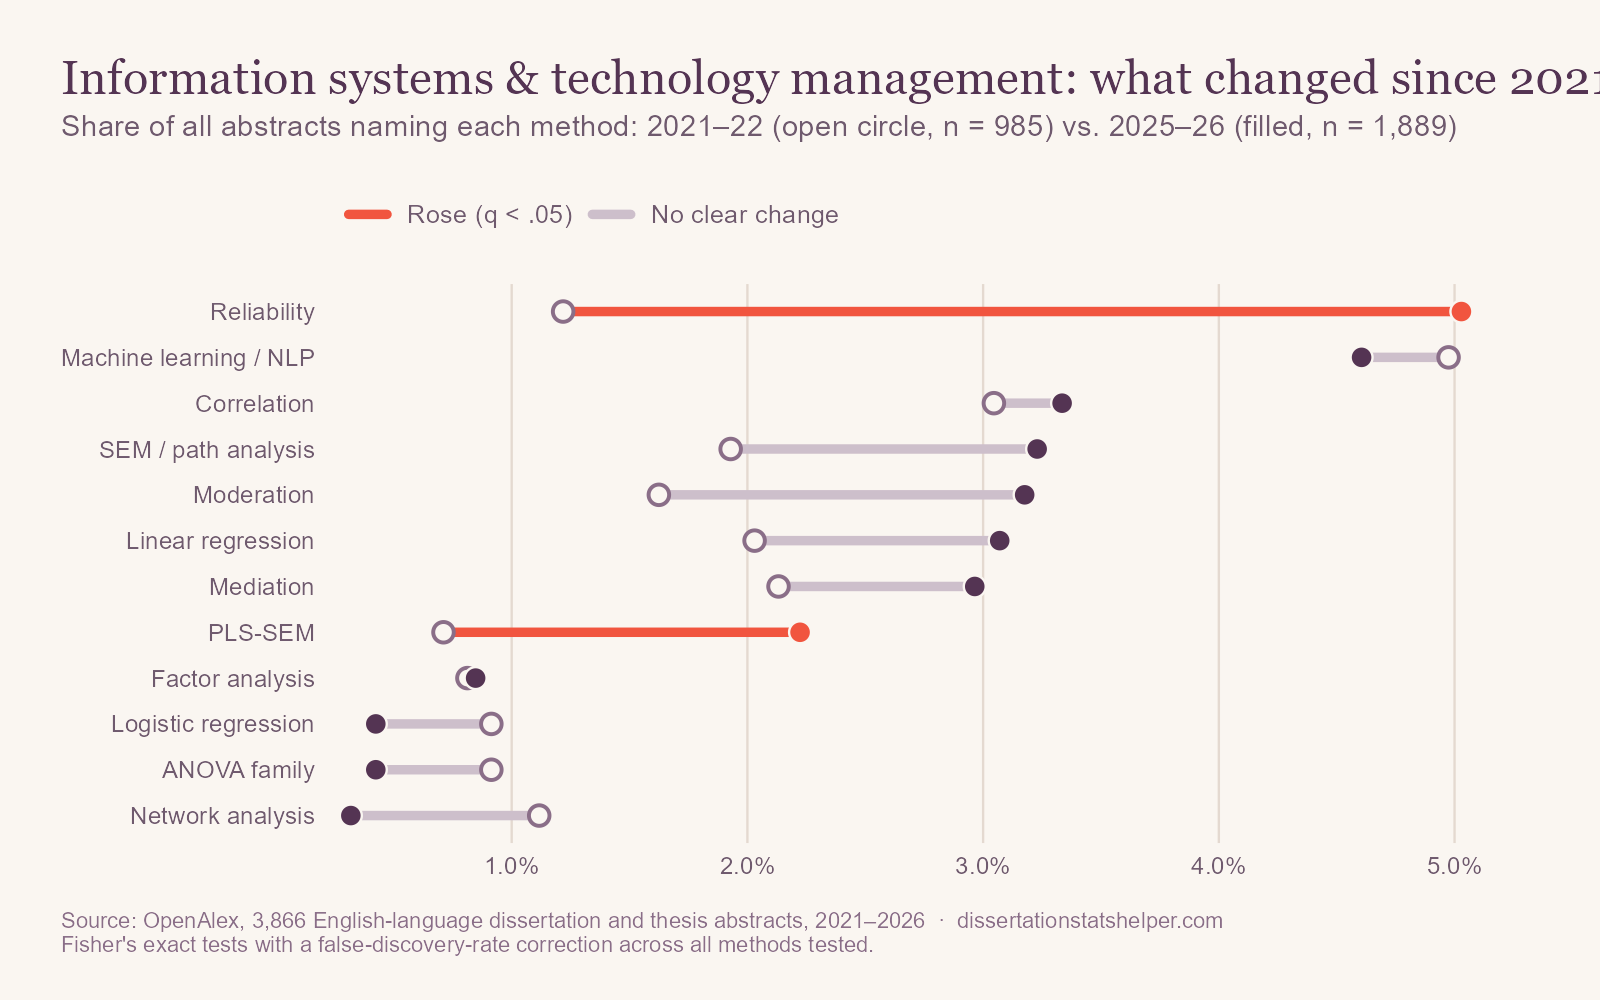
Reliability reporting rose from 1.2% to 5.0% of abstracts, and PLS-SEM from 0.7% to 2.2%, both signs of growing survey research on technology adoption. Machine learning was already common in 2021–22 and did not change clearly.
What these abstracts leave out
Two of 3,866 abstracts mention a power analysis, and none mentions missing data. Machine learning studies have their own unreported decisions: how data were split, how the model was tuned, and what baseline it beat.
If you're planning an information systems dissertation or thesis
- Beat a baseline. Report how a simple model (logistic regression, or predicting the most common class) performs, so readers can judge what the complex model adds.
- Keep test data separate. Tune on training or validation data only, and report performance once on held-out data.
- Explain the model, not just its accuracy. Committees in business want to know what drives predictions and what a manager should do with them.
- For adoption surveys, validate your measures. Technology acceptance constructs overlap; show they are distinct in your data.
How we did this
We used OpenAlex, an open index of scholarly works, to collect every English-language dissertation and thesis with an abstract published from 2021 through September 2026 in this area, and searched each title and abstract for about 40 statistical methods, including econometric methods such as panel models and difference-in-differences. The data include master's theses and many works from outside the United States, so “dissertations” here is short for all of them. Percentages describe how often abstracts mention a method, not how often it was used. Comparisons use Fisher's exact tests with a false-discovery-rate correction, and OpenAlex's coverage changes over time, so treat trends with some caution. The overview post has the full method and its limitations. The analysis code and result tables are on GitHub.