
- abstracts analyzed
- 3,867
- of method-naming abstracts use PLS-SEM
- 24%
- describe an experiment
- 2%
Marketing is where the survey-model toolkit is strongest. In our analysis of 22,179 business dissertation and thesis abstracts, it is the only area where structural equation models are the most-named method.
What is in this sample
The most common topics are consumer behavior, sustainability and green consumption, brand consumption and identification, retail behavior, service and product innovation, customer churn and segmentation, and pricing. Of the 3,867 abstracts, 35% name a quantitative method, 21% describe qualitative work, and 19% describe a survey. Only 2% describe an experiment, even though experiments are central to consumer research in journals.
The methods these dissertations name most
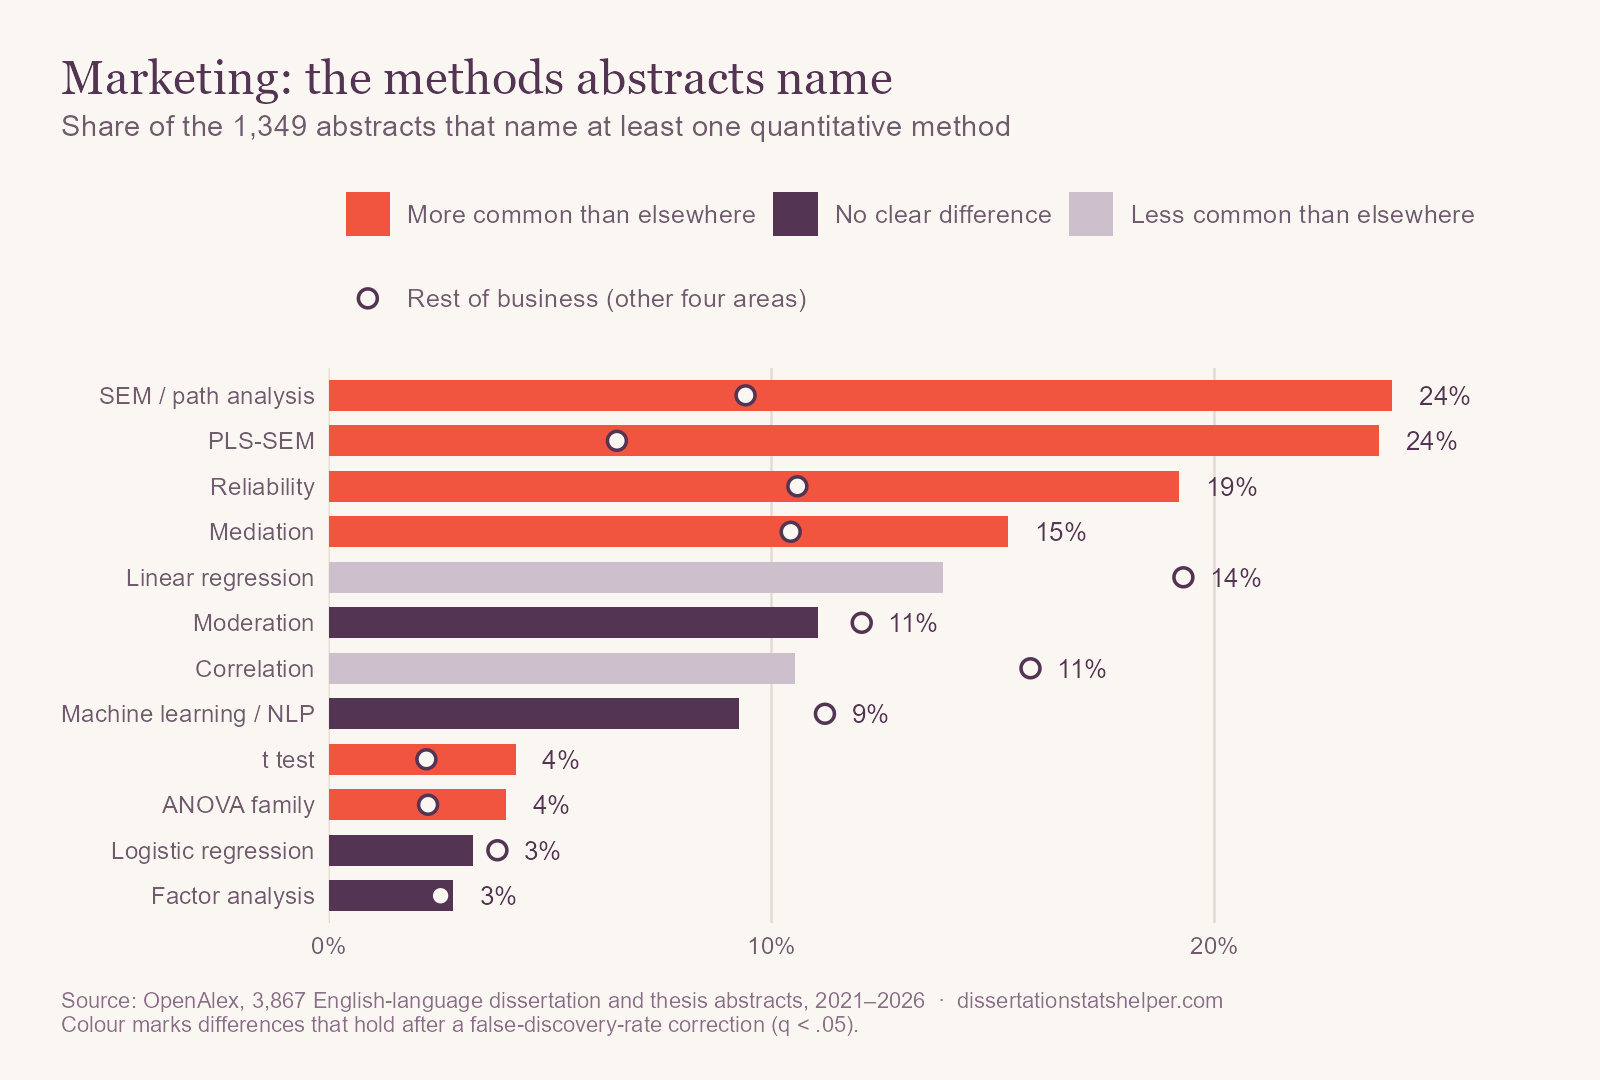
Compared with the rest of business, marketing names PLS-SEM more than three times as often (24% vs. 7%), SEM more than twice as often (24% vs. 9%), and reliability (19% vs. 11%) and mediation (15% vs. 10%) more often. Cluster analysis (3% vs. 1%) and conjoint or choice models (2.5% vs. 1.2%) are small but distinctive, used for segmentation and product preferences. Econometric methods are rare: panel data (2% vs. 11%) and causal designs (2% vs. 8%).
What changed since 2021
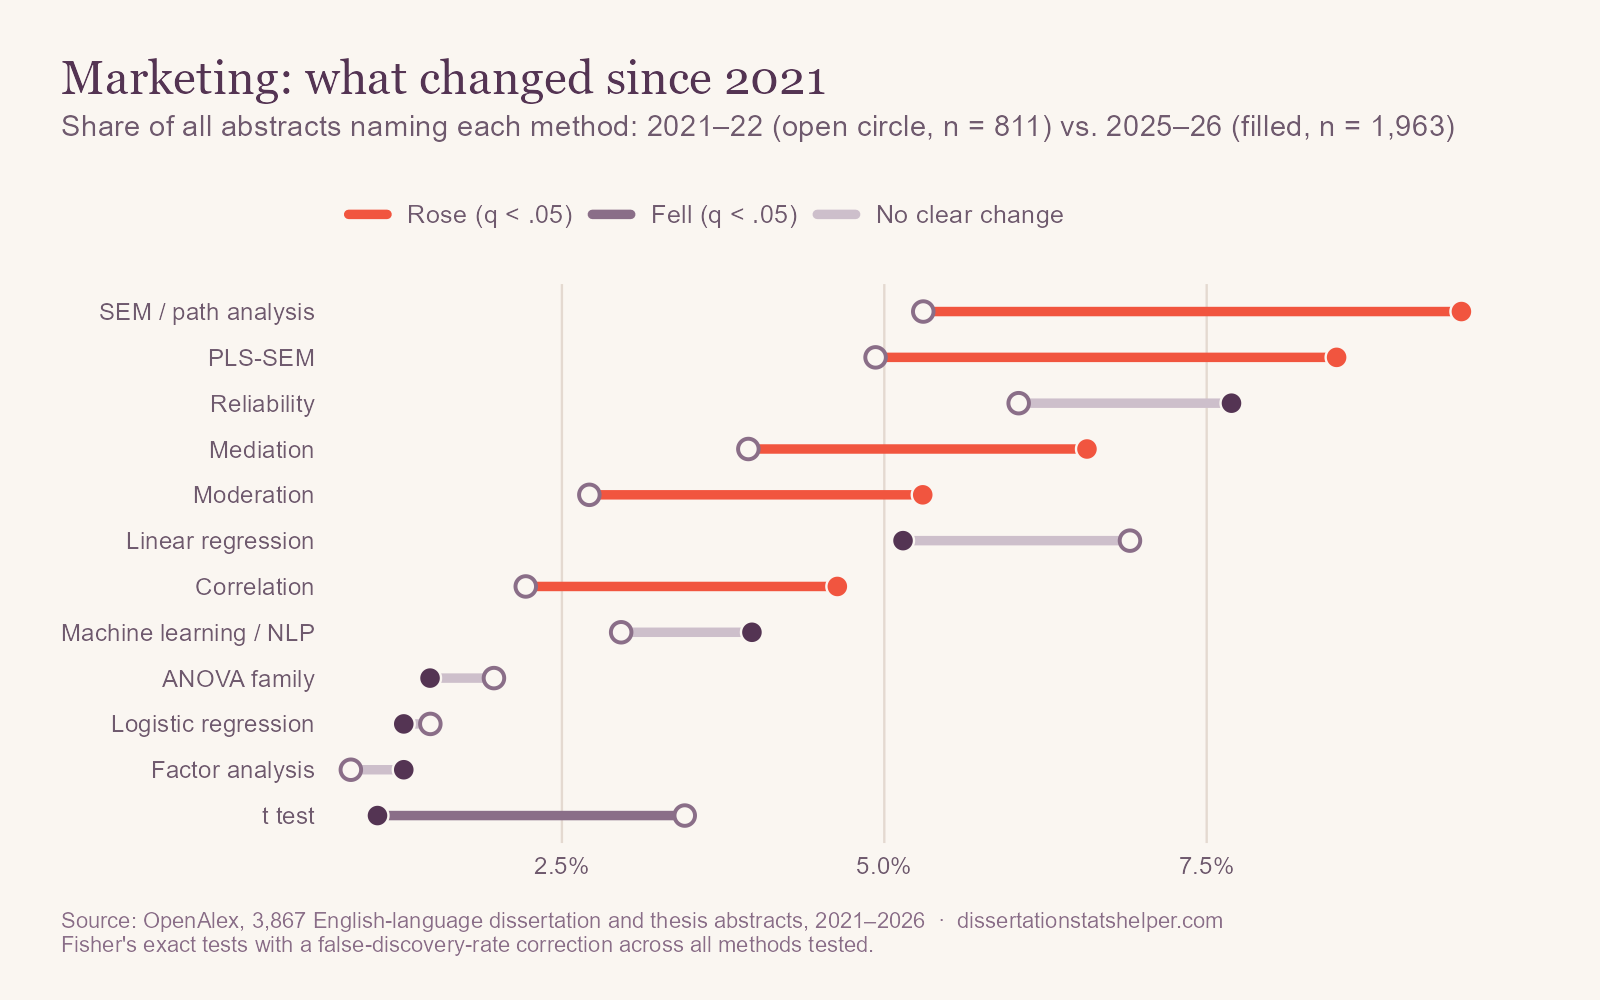
Marketing became more quantitative (30% of abstracts named a method in 2021–22, 39% in 2025–26), and the survey-model toolkit grew fastest: SEM rose from 5.3% to 9.5% of abstracts, PLS-SEM from 4.9% to 8.5%, mediation from 3.9% to 6.6%, and moderation from 2.7% to 5.3%. t tests fell from 3.5% to 1.1%.
What these abstracts leave out
One of 3,867 abstracts mentions a power analysis, and four mention missing data. Structural equation models need adequate samples, and online consumer panels need attention checks and a plan for incomplete responses.
If you're planning a marketing dissertation or thesis
- Know why you chose PLS-SEM or CB-SEM. PLS-SEM is common for prediction and complex models; covariance-based SEM is usually expected for testing theory. Your committee will ask.
- Report the measurement model first. Loadings, composite reliability, average variance extracted, and discriminant validity (such as HTMT) come before any path.
- Address common-method bias. When every construct comes from one survey, correlations are inflated. Separate measures in time or source, or at least test for it.
- Consider an experiment. If your question is whether a message, price, or design causes a response, a simple online experiment is far stronger evidence than a survey model.
How we did this
We used OpenAlex, an open index of scholarly works, to collect every English-language dissertation and thesis with an abstract published from 2021 through September 2026 in this area, and searched each title and abstract for about 40 statistical methods, including econometric methods such as panel models and difference-in-differences. The data include master's theses and many works from outside the United States, so “dissertations” here is short for all of them. Percentages describe how often abstracts mention a method, not how often it was used. Comparisons use Fisher's exact tests with a false-discovery-rate correction, and OpenAlex's coverage changes over time, so treat trends with some caution. The overview post has the full method and its limitations. The analysis code and result tables are on GitHub.