
- abstracts analyzed
- 6,650
- name a quantitative method
- 37%
- of method-naming abstracts use DiD, RDD, or IV
- 12.5%
Accounting and finance is the largest and most quantitative area in our analysis of 22,179 business dissertation and thesis abstracts. Its toolkit is econometric: archival and market data, analyzed with methods designed for observational data over time.
What is in this sample
The most common topics are financial markets and investment, corporate finance and governance, auditing and earnings management, financial literacy, Islamic finance and banking, private equity and venture capital, and banking stability and regulation. Of the 6,650 abstracts, 37% name a quantitative method and only 9% describe qualitative work, one of the lowest shares in any field we have analyzed.
The methods these dissertations name most
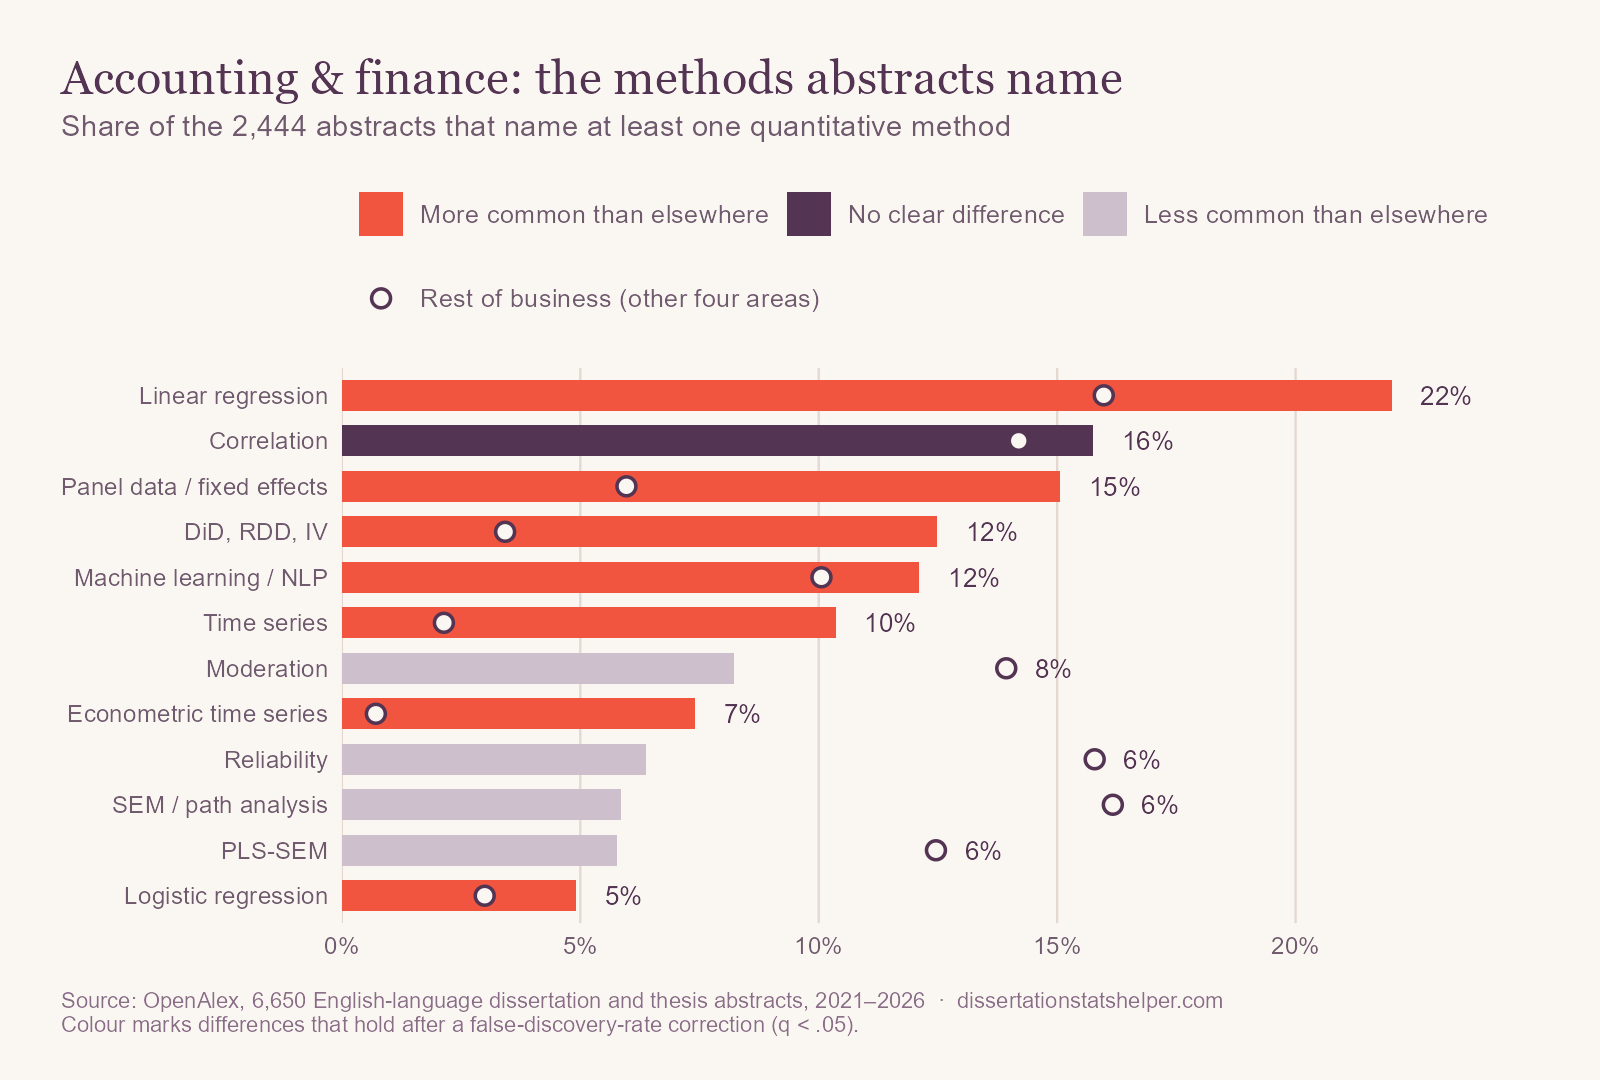
The econometric methods stand out against the rest of business:
- Panel data models (15% vs. 6%), such as firm or bank fixed effects and GMM.
- Causal designs (12.5% vs. 3%): difference-in-differences, regression discontinuity, instrumental variables, and event studies.
- Time-series models (10% vs. 2%) and econometric time series such as ARDL, GARCH, and cointegration (7% vs. 1%).
- Linear regression (22% vs. 16%), machine learning (12% vs. 10%), logistic regression (5% vs. 3%), and Bayesian methods (3% vs. 1%).
Survey-model methods are much rarer: mediation (4% vs. 16%), SEM (6% vs. 16%), and reliability (6% vs. 16%).
What changed since 2021
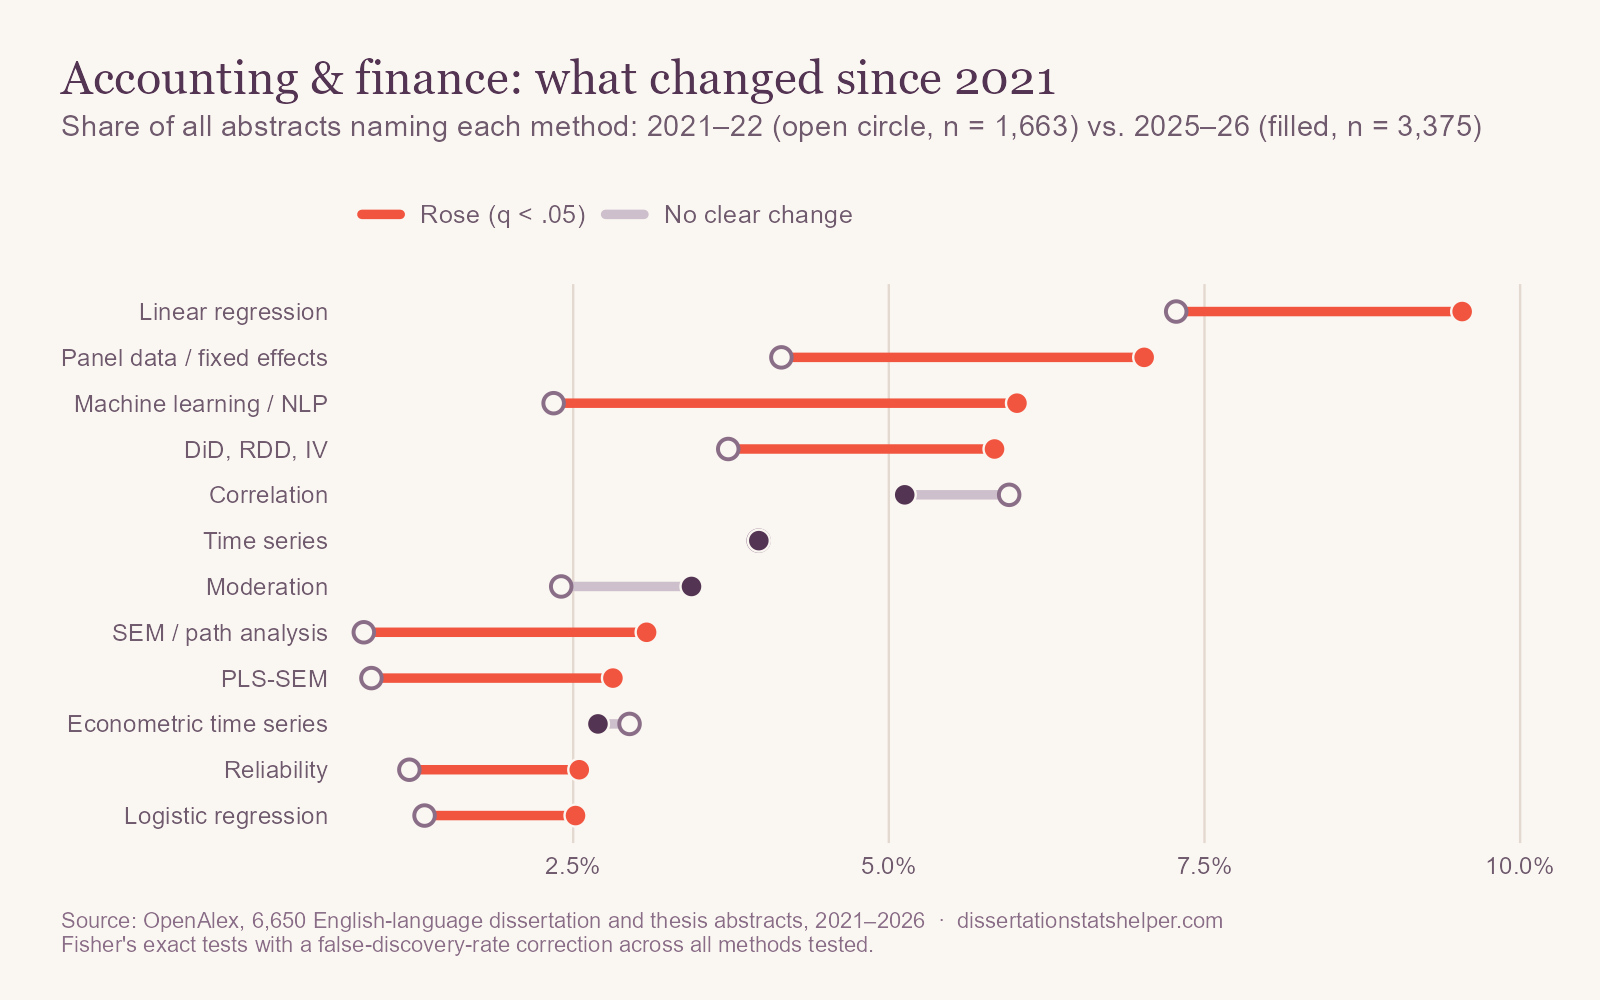
This area changed more than any other in business. The share of abstracts naming a quantitative method rose from 32% to 41%. Machine learning nearly tripled (2.3% to 6.0% of abstracts), panel models rose from 4.1% to 7.0%, and causal designs from 3.7% to 5.8%. Survey methods grew too, from a low base: SEM from 0.8% to 3.1% and PLS-SEM from 0.9% to 2.8%.
What these abstracts leave out
None of the 6,650 abstracts mentions a power analysis, and eight mention missing data. For archival designs, the bigger unreported decisions are sample construction, outlier treatment (winsorizing), and how standard errors were clustered.
If you're planning an accounting or finance dissertation or thesis
- Cluster your standard errors. Firm-year observations are not independent; cluster by firm (and by time where needed), and say so.
- Test the assumptions behind your design. Difference-in-differences needs parallel pre-trends; instruments need relevance and a credible exclusion argument; event studies need a clean estimation window.
- Check stationarity before time-series models. Unit-root and cointegration tests decide which model is valid.
- Validate prediction honestly. For machine learning, test on later periods than you trained on, so the model can't see the future.
How we did this
We used OpenAlex, an open index of scholarly works, to collect every English-language dissertation and thesis with an abstract published from 2021 through September 2026 in this area, and searched each title and abstract for about 40 statistical methods, including econometric methods such as panel models and difference-in-differences. The data include master's theses and many works from outside the United States, so “dissertations” here is short for all of them. Percentages describe how often abstracts mention a method, not how often it was used. Comparisons use Fisher's exact tests with a false-discovery-rate correction, and OpenAlex's coverage changes over time, so treat trends with some caution. The overview post has the full method and its limitations. The analysis code and result tables are on GitHub.