
- of method-naming education abstracts name reliability
- 18%
- in business
- 12%
- of all psychology abstracts, 2021–22 vs. 2025–26
- 2.3% → 3.8%
Reliability is the consistency of your measurements: whether items in a scale agree, whether scores are stable over time, or whether raters coding the same material reach the same result. It shows up throughout dissertations. In our analysis of recent abstracts, reliability appears in 18% of method-naming education abstracts and 12% in business, and in psychology its share of all abstracts rose from 2.3% to 3.8% between 2021–22 and 2025–26.
Most of those dissertations report a single Cronbach's alpha. This guide covers what reliability means, how to match the coefficient to the question, the limits of alpha, omega, item diagnostics, reliability for raters and repeated measurements, syntax, and how to report it in APA 7.
What reliability is, and isn't
In classical test theory, reliability is the share of variation in observed scores that reflects true differences between people rather than measurement error. Two consequences matter for a dissertation:
- Reliability belongs to scores in a sample, not to a test. A scale with α = .90 in its validation study can have lower reliability in your sample, especially if your sample is more homogeneous (Vacha-Haase, 1998). Report reliability for your own data, not only the published value.
- Reliability is not validity. A scale can measure the wrong thing very consistently. Reliability is necessary evidence, not sufficient evidence, that your scores mean what you claim.
Match the coefficient to the question
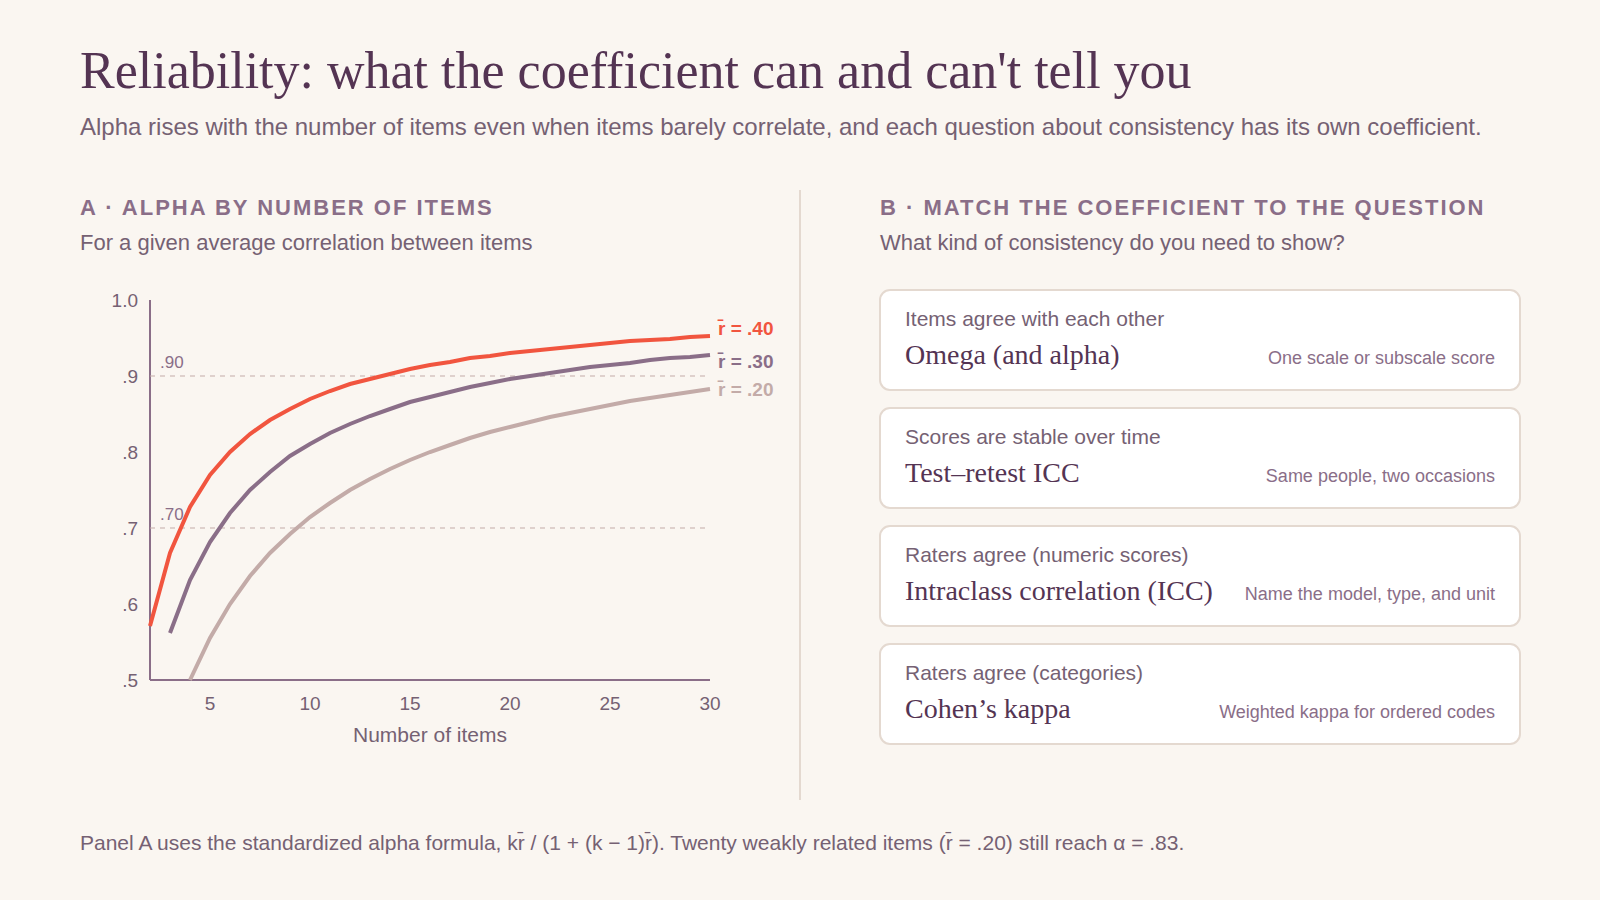
- Internal consistency: do the items of a scale measure the same thing? Report omega, and alpha if your committee expects it, for each scale or subscale you score.
- Test–retest reliability: are scores stable over time? Use an intraclass correlation across the two occasions, and choose an interval short enough that the construct shouldn't have changed.
- Interrater reliability for numeric ratings: do raters give the same scores? Use an intraclass correlation (ICC).
- Interrater agreement for categories: do coders assign the same codes? Use Cohen's kappa, weighted kappa for ordered categories, or Krippendorff's alpha for more than two coders or missing codes.
Cronbach's alpha and its limits
Alpha is the most reported reliability coefficient, and it is easy to misread:
- It assumes every item is equally related to the construct (tau-equivalence). When items differ in how strongly they reflect the construct, which is common, alpha underestimates reliability.
- It rises with the number of items. Twenty items that correlate only .20 on average reach α = .83 (see the figure). A long scale can have a high alpha without its items hanging together well.
- A high alpha doesn't show that a scale is unidimensional (Cortina, 1993; Sijtsma, 2009). A scale made of two distinct but related subscales can still have a high alpha. Check dimensionality with factor analysis first.
- Correlated errors, such as items with near-identical wording, inflate it.
Omega (McDonald, 1999) is computed from a factor model, so it allows items to differ in how strongly they reflect the construct. For a unidimensional scale, report omega total. For a scale with a general factor and subscales, omega hierarchical tells you how much of the total score reflects the general factor. McNeish (2018) makes the case for moving from alpha to omega; because many committees still expect alpha, report both.
Benchmarks. Values of about .70 are a common minimum for research use, .80 or higher is better, and decisions about individuals call for .90 or higher (Nunnally & Bernstein, 1994). Very high values, above about .95, can signal redundant items rather than an excellent scale.
Item diagnostics
- Corrected item–total correlations: how well each item relates to the rest of the scale. Values below about .30 are commonly flagged.
- A negative item–total correlation almost always means a reverse-worded item wasn't reverse-scored. Fix the scoring before anything else.
- Alpha if item deleted: shows how much alpha would change without each item. Don't delete items from an established scale only to raise alpha; that changes the scale, makes your scores incomparable with other studies, and capitalizes on your sample. If you remove an item, give a content reason and report the change.
Reliability for raters and repeated measurements
There are several intraclass correlations, and they can give very different values. Name the one you used by its three choices (Shrout & Fleiss, 1979; Koo & Li, 2016):
- Model: one-way random, two-way random (raters are a sample of possible raters), or two-way mixed (these raters are the only ones of interest).
- Type: consistency (raters rank cases the same way) or absolute agreement (raters give the same scores).
- Unit: a single rater's scores, or the average of several raters.
Koo and Li (2016) suggest reading ICCs below .50 as poor, .50 to .75 as moderate, .75 to .90 as good, and above .90 as excellent, judged by the confidence interval as well as the estimate. For categorical codes, report kappa with the percentage agreement, and say how many cases were double-coded and how disagreements were resolved.
Running it
In R with psych and semTools:
library(psych)
alpha(items)                        # alpha, item-total correlations, alpha if deleted
omega(items, nfactors = 1)          # omega total for a one-factor scale

library(lavaan); library(semTools)
fit <- cfa('belong =~ b1 + b2 + b3 + b4 + b5 + b6', data = dat)
compRelSEM(fit)                     # omega from the CFA

ICC(ratings)                        # the six Shrout–Fleiss ICCs with CIs
cohen.kappa(codes)                  # kappa and weighted kappa
In SPSS, use Analyze > Scale > Reliability Analysis. Choose “Scale if item deleted” under Statistics for item diagnostics, and the intraclass correlation option there for ICCs, where you set the model and type. Recent versions also offer McDonald's omega as a model.
RELIABILITY
  /VARIABLES=b1 b2 b3 b4 b5 b6
  /SCALE('Belonging') ALL
  /MODEL=ALPHA
  /SUMMARY=TOTAL.
Reporting it in APA 7
For each scale, report the coefficient in your sample with its confidence interval, the number of items, and any items reversed or removed. For multidimensional measures, report each subscale you score. For raters, report the coefficient and its exact form, the number of cases double-coded, rater training, and how disagreements were resolved. These made-up numbers are internally consistent, so you can use them as a template:
Internal consistency of the six-item Belonging scale in this sample (N = 348) was good, ω = .87, α = .86, 95% CI [.83, .88]. Two negatively worded items were reverse-scored before analysis, and corrected item–total correlations ranged from .52 to .71. Because a confirmatory factor analysis supported three correlated factors for the Teacher Support measure, we report reliability for each subscale (ω = .81, .84, and .79) rather than for a total score.
Two trained raters independently scored 60 of the 300 classroom observations (20%). Interrater reliability for the overall quality score was good, ICC(2,1) = .82, 95% CI [.71, .89], based on a two-way random-effects model for absolute agreement of single ratings. For the categorical feedback code, agreement was 88%, Cohen's κ = .76. Disagreements were resolved by discussion before analysis.
Our results chapter guide covers the general APA 7 formatting rules.
When one coefficient isn't enough
- Multidimensional scales. Report reliability for each subscale, and use omega hierarchical if you also use a total score.
- A new population or language. Reliability alone doesn't show the scale works the same way; test its factor structure and, if you compare groups, measurement invariance. Our EFA and CFA guide covers both.
- Measurement error in your main analysis. Even good reliability weakens the relationships you estimate. Latent-variable models, covered in our SEM guide, correct for it.
- Decisions about individuals. Report the standard error of measurement, which tells you how precise an individual score is, not just the reliability coefficient.
Questions committees ask
“Your alpha is .68. Is the scale usable?” Report it honestly with its confidence interval, check omega and item diagnostics, and discuss what lower reliability means for your results: weaker observed relationships and less power, not automatic disqualification.
“Why report omega?” Because it doesn't assume all items are equally strong indicators, which alpha does and your data rarely support.
“The manual reports α = .90. Why compute your own?” Reliability depends on the sample. Yours is the value that applies to your results.
“Did you drop items to raise alpha?” If you removed items, show the content reason, report the scale with and without them, and note that scores may not be comparable with other studies.
“Which ICC did you use?” Name the model, type, and unit, and say why they fit your design.
Common mistakes
- Citing only the published reliability instead of computing it in your sample.
- One alpha for a multidimensional measure.
- Treating a high alpha as proof of unidimensionality.
- Forgetting to reverse-score items, visible as negative item–total correlations.
- Deleting items to push alpha over .70 without a content reason.
- “ICC = .82” with no model, type, or unit.
- Percentage agreement alone for categorical codes, without kappa.
Checklist
- Coefficient chosen to match the question (internal consistency, stability, or rater agreement)
- Reliability computed in your own sample, with a confidence interval
- Omega, and alpha if expected, for each scale or subscale scored
- Dimensionality checked before computing internal consistency
- Reverse-scored items and any removed items reported
- Item–total correlations reviewed
- ICC model, type, and unit named; kappa with percent agreement for codes
- Double-coding proportion, rater training, and disagreement resolution described
- Implications of lower reliability discussed
How we did this
The guidance draws on Nunnally and Bernstein's Psychometric Theory (3rd ed., McGraw-Hill, 1994), McDonald's Test Theory (Erlbaum, 1999), and the studies cited above: Cortina (1993), Journal of Applied Psychology; Vacha-Haase (1998), Educational and Psychological Measurement; Sijtsma (2009), Psychometrika; McNeish (2018), Psychological Methods; Shrout and Fleiss (1979), Psychological Bulletin; and Koo and Li (2016), Journal of Chiropractic Medicine. The figure's alpha values use the standardized alpha formula. The shares of abstracts come from our education, business, and psychology methods overviews, built from OpenAlex dissertation and thesis abstracts. The analysis code and result tables are on GitHub.