
- abstracts analyzed
- 18,617
- name a quantitative method
- 18%
- mention a power analysis
- 0
Which statistical methods do education dissertations actually use? We collected every English-language education dissertation and thesis with an abstract published since 2021 (18,617 abstracts), grouped them by research topic, and counted which methods they name. As in our psychology series, “dissertations” is short for dissertations and theses.
This post is the overview. Each area has its own breakdown: teaching, learning, and curriculum, online and technology-enhanced learning, higher and adult education, leadership, teachers, and policy, and early childhood, family, and inclusive education.
Education is mostly qualitative, or silent about method
Only 18% of education abstracts (3,417) name a quantitative method. More describe qualitative work (27%), and others describe surveys (14%), case studies (8%), mixed methods (5%), or action research (3%). Fewer than 2% describe an experiment.
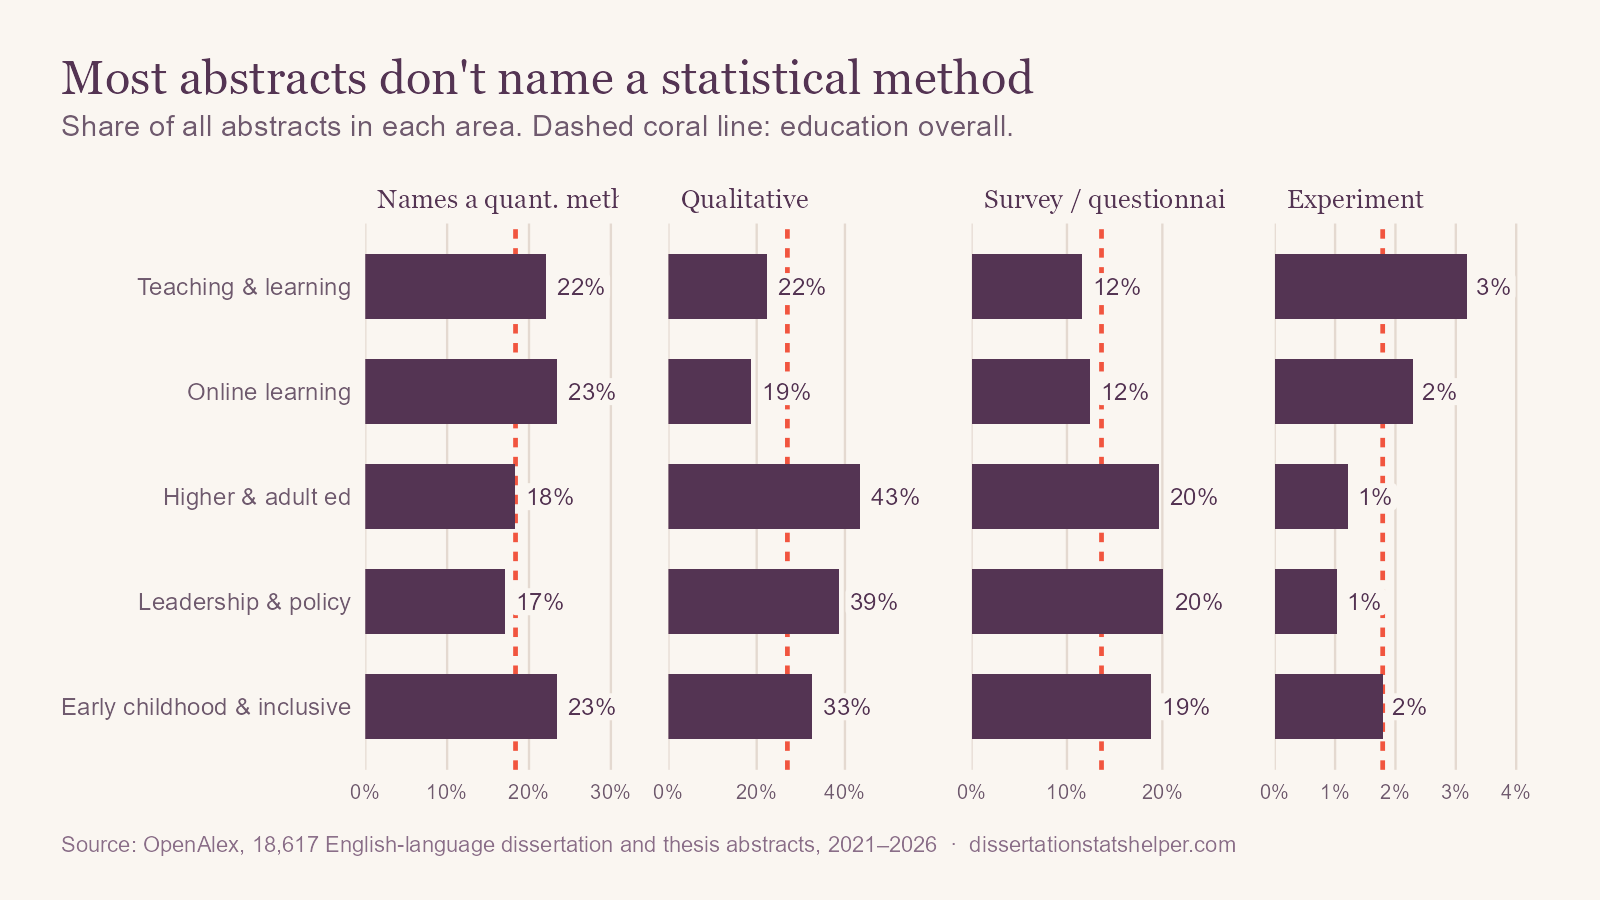
Higher education (43%) and leadership and policy (39%) are the most qualitative areas. Teaching and online learning are the least qualitative, but the quantitative work they do is of a particular kind, as the next section shows.
Two different toolkits
Among the 3,417 abstracts that name a method, t tests lead (24%), followed by reliability (18%), correlation (16%), and linear regression (8%). But that average hides two very different groups.
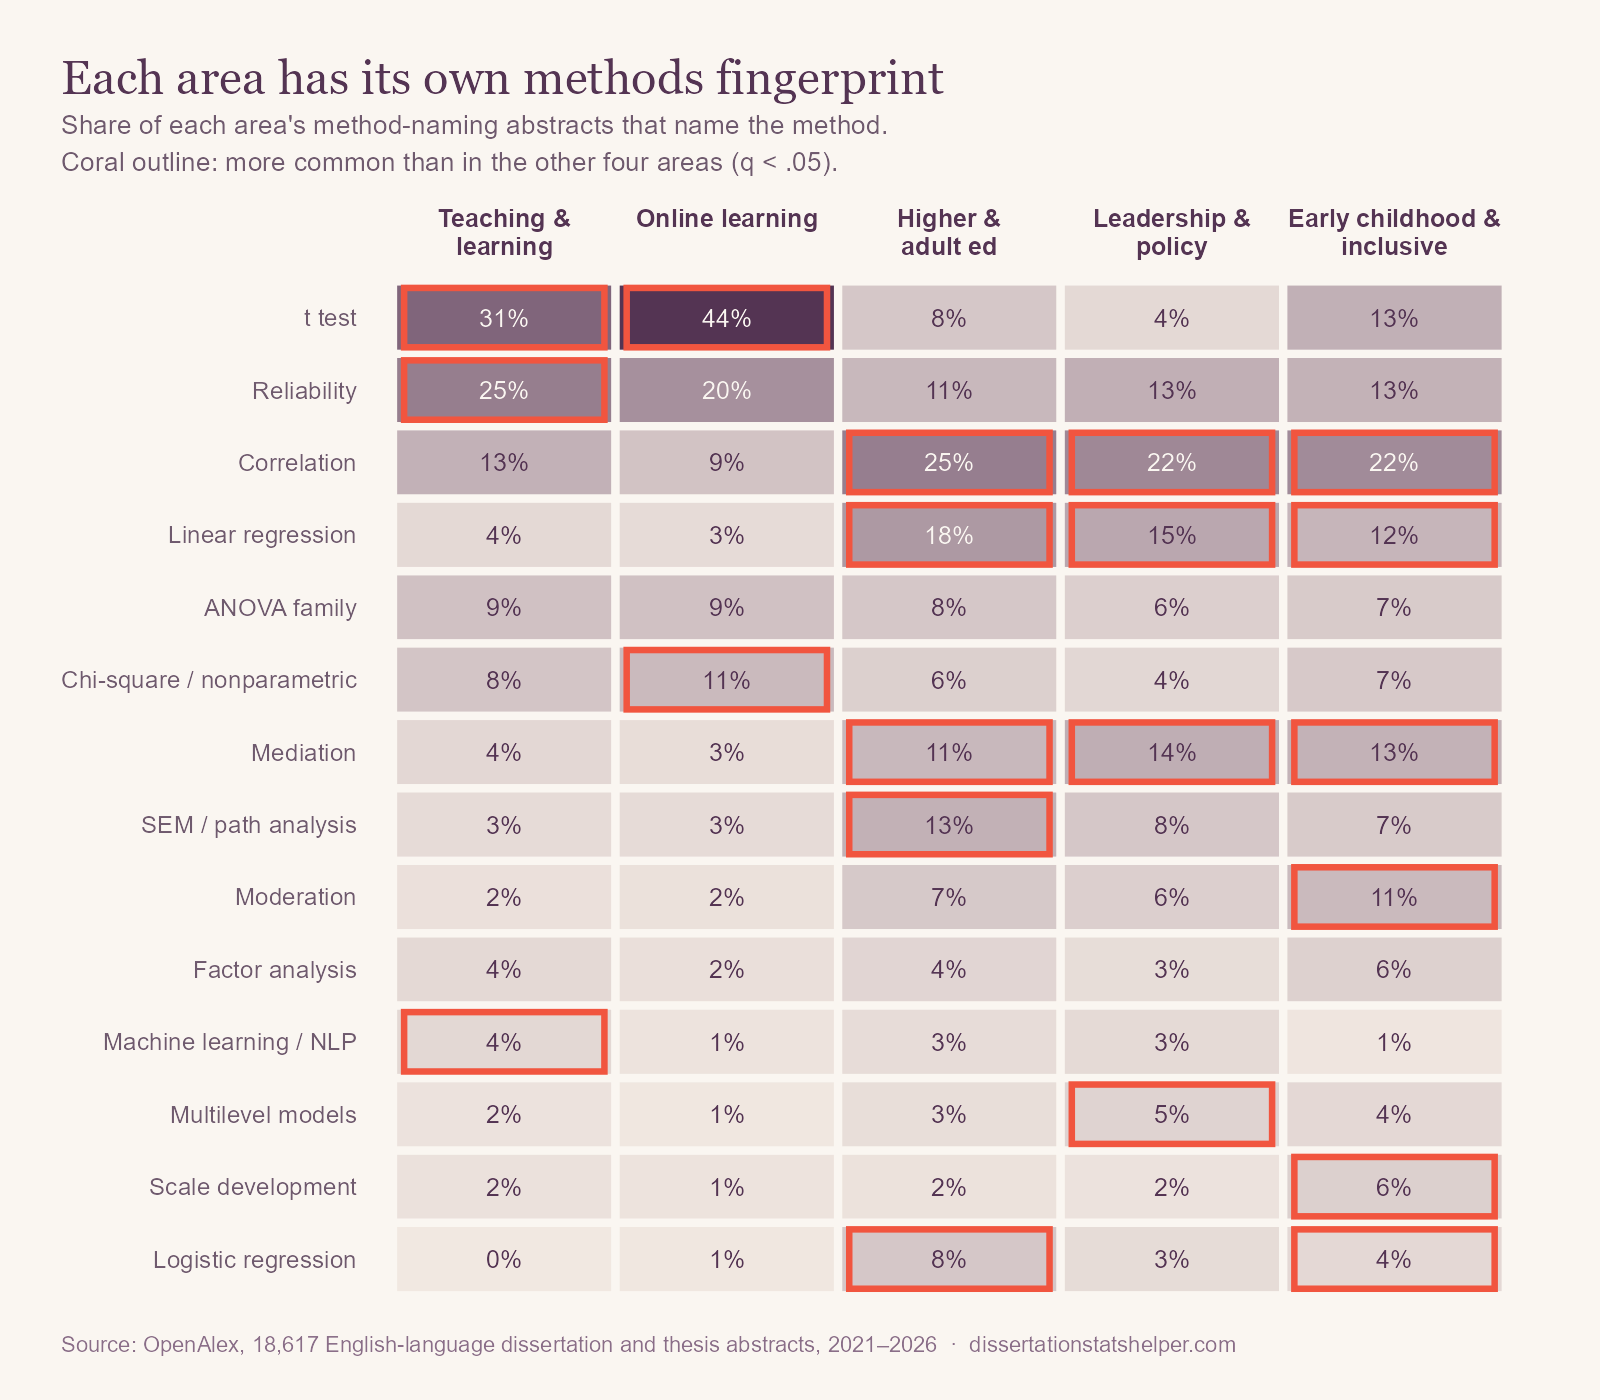
- Classroom and online learning studies use a pretest–posttest toolkit: t tests (31% and 44% of method-naming abstracts), reliability for the test or questionnaire (25% and 20%), and chi-square comparisons.
- Higher education, leadership and policy, and early childhood use an explanatory toolkit: correlation (22–25%), linear regression (12–18%), and mediation (11–14%). Leadership and policy also has the most causal-inference designs, such as difference-in-differences and regression discontinuity (7%).
US-based education research looks different
OpenAlex records the institution's country for only 12% of these works, and 6% are tagged as US institutions. That small US-tagged group looks very different from everything else:
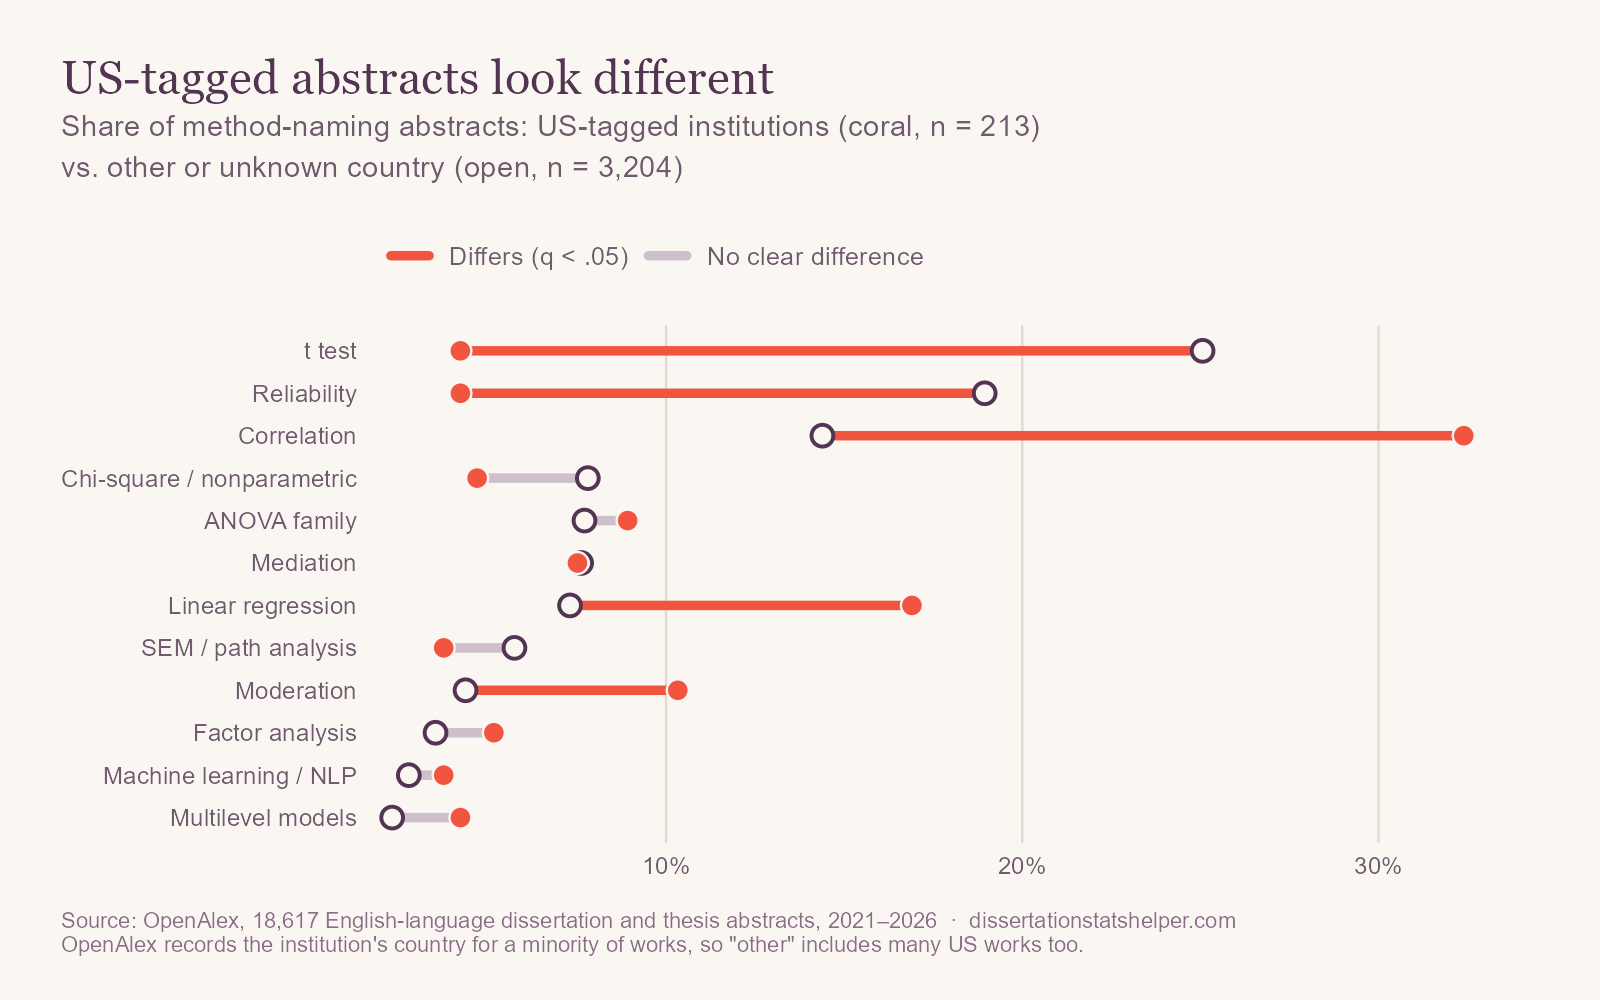
US-tagged abstracts are far more often qualitative (48% vs. 26%). When they are quantitative, they name correlation (32% vs. 14%), linear regression (17% vs. 7%), and moderation (10% vs. 4%) more than twice as often, logistic regression four times as often (8.5% vs. 2%), and t tests (4% vs. 25%) and reliability (4% vs. 19%) far less. Much of the t-test-heavy classroom research in the index comes from repositories outside the United States, many of them in Indonesia. If you are writing an EdD or PhD dissertation in the United States, the explanatory toolkit is the more realistic benchmark.
What changed since 2021
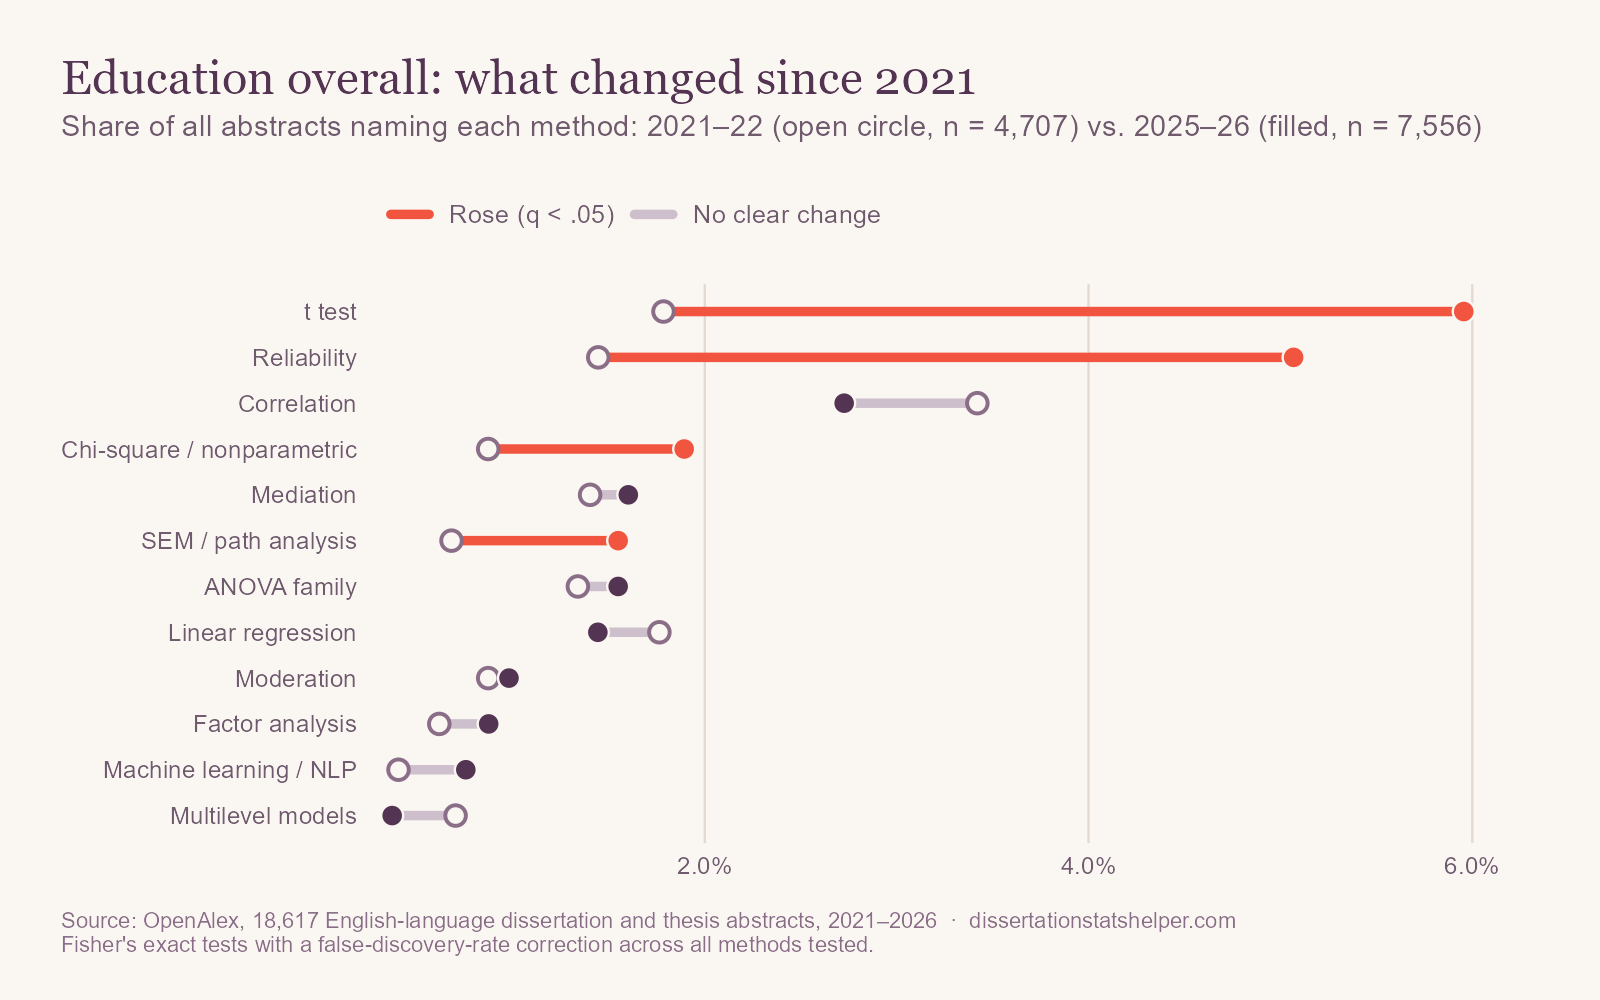
On paper, education became more quantitative (16% of abstracts named a method in 2021–22, 22% in 2025–26), with big rises in t tests (1.8% to 6.0% of abstracts) and reliability (1.4% to 5.1%). But the mix of sources changed at the same time: abstracts naming Indonesia, Islamic schools, or other Global South contexts rose from 16% to 28%, while those with US markers (such as “United States,” a state name, or “K-12”) fell from 14% to 6%. Most of this “trend” is a change in what OpenAlex indexes, not in how education researchers work. The rise in structural equation models (0.7% to 1.5%) also appears in leadership and policy, the area with more US work, so it may be more than a coverage effect.
What abstracts leave out
None of the 18,617 abstracts mentions a power analysis, and 6 mention missing data. In education, where students sit in classrooms and schools and attrition over a semester is normal, both belong in your methods chapter.
That fits APA’s own guidance. Its reporting standards ask a quantitative abstract for the research design, sample size, measures, and findings with effect sizes, not the name of the statistical test or the power analysis; those belong in the Method section. Our guide to writing a dissertation abstract covers what to include, with data on what real abstracts leave out.
What this means if you're planning a dissertation
- Benchmark against the right work. Look at recent dissertations from your own program and country, not the global average.
- If you use a pre/post design, go beyond two t tests. With a comparison group, analysis of covariance or a mixed model is usually stronger, and effect sizes with confidence intervals matter more than p-values.
- Account for clustering. Students in the same classroom are not independent. Multilevel models appear in only 2% of method-naming abstracts, but committees increasingly expect them.
- Plan power and missing data. Neither appears in abstracts; both come up at the defense. Our free power planning hub covers cluster designs.
Read the area breakdowns
- Teaching, learning, and curriculum: the pretest–posttest toolkit.
- Online and technology-enhanced learning: t tests in 44% of method-naming abstracts.
- Higher and adult education: regression, SEM, and student outcomes.
- Leadership, teachers, and policy: regression, mediation, and causal designs.
- Early childhood, family, and inclusive education: mediation, moderation, and dyads.
How we did this
We used OpenAlex to collect every English-language work typed as a dissertation or thesis, with an abstract, published from 2021 through September 2026, in the Education subfield. We kept the 18,617 abstracts longer than 60 words and searched each title and abstract for about 40 methods using a keyword dictionary we spot-checked for false matches (for example, we count “trajectory” as a growth model only in phrases such as “trajectory analysis,” not “career trajectory”). We grouped abstracts into five areas using OpenAlex research topics; about a quarter of abstracts, including language and religious education, fall outside those areas and appear only in this overview.
Keep these limitations in mind. Percentages describe how often abstracts mention a method, not how often it was used. The data are international and include master's theses and probably some undergraduate theses; country is known for only 12% of works. OpenAlex's topic labels are assigned by an algorithm and the boundaries are loose. The source mix changed over time, which affects trends. Comparisons use Fisher's exact tests with a Benjamini–Hochberg false-discovery-rate correction across all methods tested.
The analysis code, the method dictionary, and the result tables behind every number here are on GitHub, under the MIT License.