
- abstracts analyzed
- 2,487
- of method-naming abstracts use t tests
- 44%
- use multilevel models
- 0.5%
Online and blended learning grew into one of the largest topics in education research during and after the pandemic. In our analysis of 18,617 education dissertation and thesis abstracts, it is the area most dominated by a single test.
What is in this sample
Two-thirds of the 2,487 abstracts fall under online learning methods and innovations, followed by blended learning, technology-enhanced education, technology integration, and e-learning during COVID-19. Of the 2,487 abstracts, 23% name a quantitative method, 19% describe qualitative work, and 12% describe a survey. Only 3% are tagged as US institutions.
The methods these dissertations name most
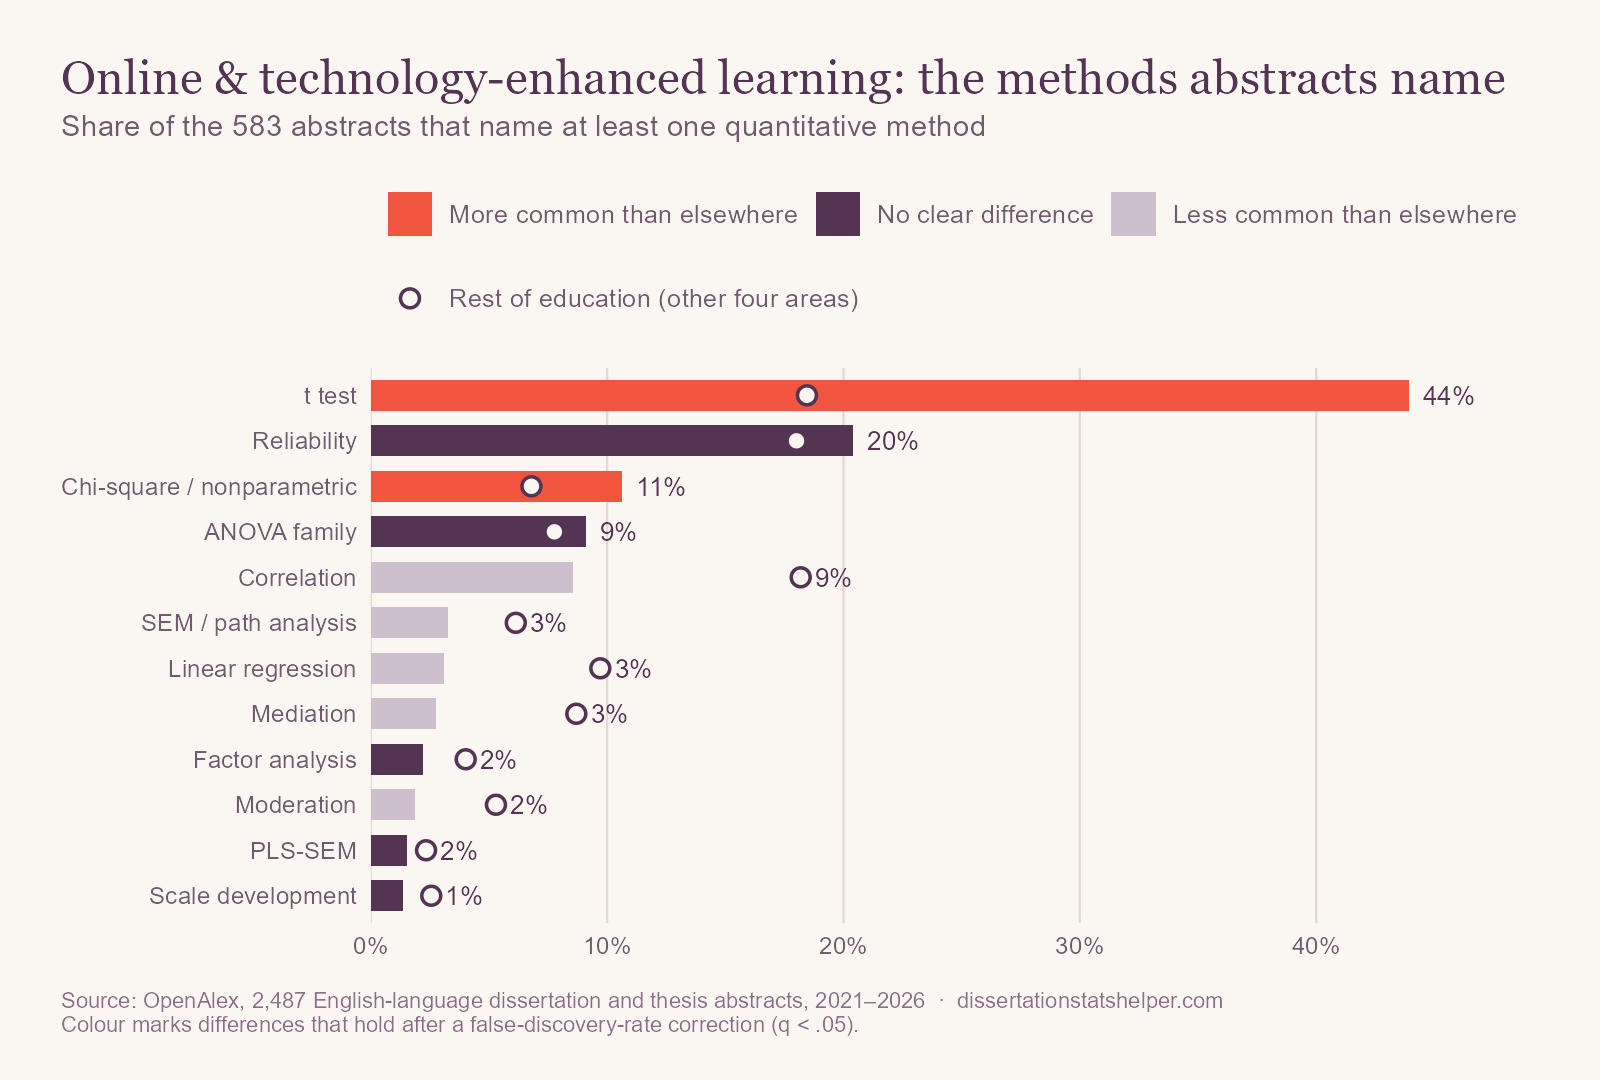
t tests appear in 44% of method-naming abstracts, compared with 18.5% in the rest of education, and chi-square and nonparametric tests in 11% (vs. 7%). The typical study compares an online or technology-supported class with a conventional one, or scores before and after a new tool.
Almost every explanatory model is less common here: correlation (9% vs. 18%), mediation (3% vs. 9%), linear regression (3% vs. 10%), and multilevel models (0.5% vs. 2.9%). Growth models don't appear at all. That is a gap worth noticing, because online platforms produce exactly the repeated, nested data those models are built for.
A note on change over time
t tests rose from 4.4% to 13.5% of abstracts in this area, and reliability from 1.6% to 7.3%. OpenAlex added many repositories from outside the United States during this period, so shifts in education reflect who is in the index as much as how methods are changing. We don't chart them for that reason.
What these abstracts leave out
None of the 2,487 abstracts mentions a power analysis or missing data. Online courses lose students quickly, and who drops out is rarely random, so how you handle missing posttests can change your conclusion.
If you're planning an online learning dissertation or thesis
- Compare groups fairly. Students who choose online sections differ from those who don't. Adjust for prior achievement, or use matching, before crediting the format.
- Use the log data. Learning management systems record logins, time on task, and submissions over weeks. Growth or multilevel models can show how engagement changes, not just the end result.
- Plan for dropout. Report how many students completed each measure, compare completers with non-completers, and use methods that handle missing data properly.
- Report effect sizes. A significant t test with a large class can be a trivial gain.
How we did this
We used OpenAlex, an open index of scholarly works, to collect every English-language dissertation and thesis in education with an abstract published from 2021 through September 2026, grouped them by OpenAlex research topic, and searched each title and abstract for about 40 statistical methods. The data include master's theses, probably some undergraduate theses, and many works from outside the United States, so “dissertations” here is short for all of them. Percentages describe how often abstracts mention a method, not how often it was used. Comparisons use Fisher's exact tests with a false-discovery-rate correction. The overview post has the full method and its limitations. The analysis code and result tables are on GitHub.