
- abstracts analyzed
- 2,016
- of method-naming abstracts use moderation
- 11%
- use dyadic models
- 6%
Early childhood, family, and inclusive education sits between education and developmental psychology, and its methods show it. In our analysis of 18,617 education dissertation and thesis abstracts, it is the area most focused on relationships: between parents and children, teachers and students, and risks and outcomes.
What is in this sample
The most common topics are early childhood education and development, child development, parental involvement, children and digital technology, and collaborative teaching and inclusion. Of the 2,016 abstracts, 23% name a quantitative method (tied for the highest share in education), 33% describe qualitative work, and 19% describe a survey. Twelve percent are tagged as US institutions.
The methods these dissertations name most
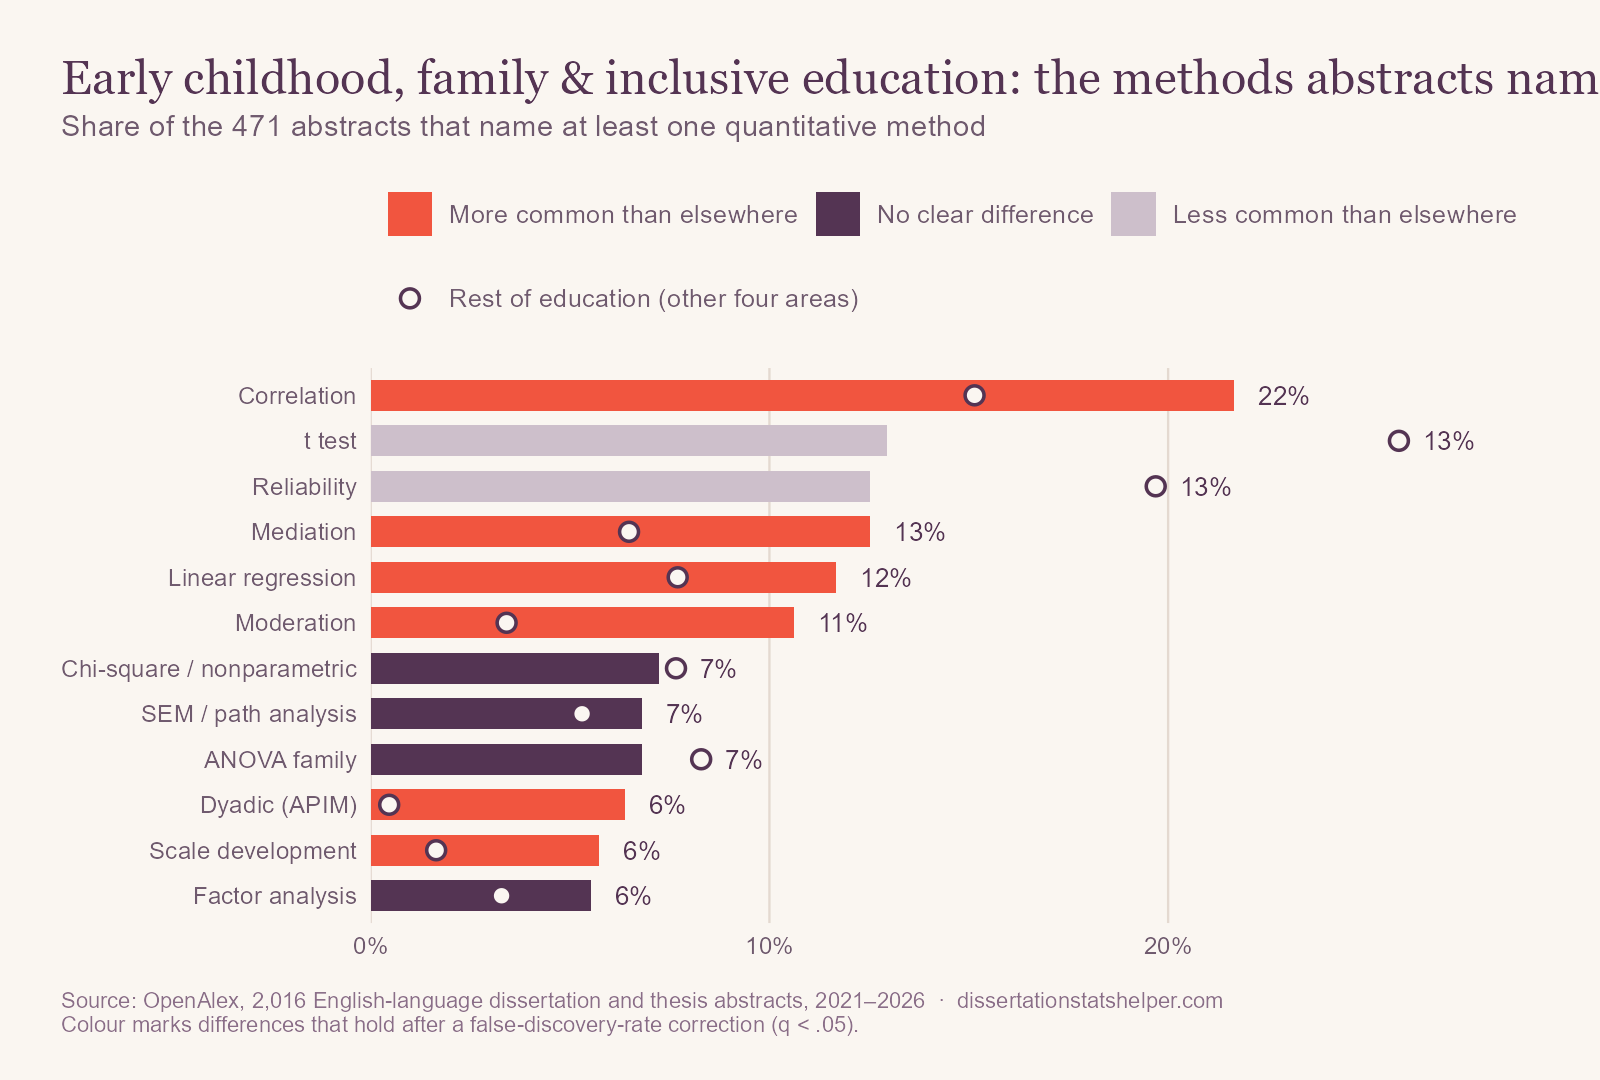
More methods stand out here than in any other education area:
- Mediation (12.5% vs. 6.5%) and moderation (11% vs. 3%): how family and school factors shape child outcomes, and for whom.
- Dyadic models (6% vs. 0.5%): parent–child and teacher–child pairs.
- Scale development (6% vs. 2%): building measures for young children and families.
- Latent profile and class analysis (4% vs. 1%): identifying groups of children or families with similar patterns.
- Growth models (3% vs. 0.3%) and logistic regression (4% vs. 2%).
t tests (13% vs. 26%) and reliability (13% vs. 20%) are less common than elsewhere in education.
A note on change over time
t tests rose from 1.3% to 4.3% of abstracts in this area. OpenAlex added many repositories from outside the United States during this period, so shifts in education reflect who is in the index as much as how methods are changing. We don't chart them for that reason.
What these abstracts leave out
None of the 2,016 abstracts mentions a power analysis, and two mention missing data. Studies with parents and young children often have incomplete reports from one informant or another, and moderation effects need large samples.
If you're planning an early childhood or inclusive education dissertation or thesis
- Model pairs as pairs. A parent's and a child's scores are linked. The actor–partner interdependence model estimates each person's effect on themselves and on the other.
- Power your moderation. Testing whether an effect differs by disability status, age, or income needs much more data than testing the main effect.
- Use profiles thoughtfully. Latent profile analysis finds groups, but the number of profiles is a judgment call. Report fit indices, profile sizes, and why you chose the solution.
- Validate measures for your population. Scales built for older children or other cultures may not work the same way; check reliability and structure in your sample.
How we did this
We used OpenAlex, an open index of scholarly works, to collect every English-language dissertation and thesis in education with an abstract published from 2021 through September 2026, grouped them by OpenAlex research topic, and searched each title and abstract for about 40 statistical methods. The data include master's theses, probably some undergraduate theses, and many works from outside the United States, so “dissertations” here is short for all of them. Percentages describe how often abstracts mention a method, not how often it was used. Comparisons use Fisher's exact tests with a false-discovery-rate correction. The overview post has the full method and its limitations. The analysis code and result tables are on GitHub.