
- abstracts analyzed
- 50,799
- name a quantitative method
- 21%
- mention a power analysis
- 6
Which statistical methods do social science and health dissertations actually use? We collected every English-language dissertation and thesis with an abstract published since 2021 in six fields (50,799 abstracts) and counted which methods they name. As in our psychology, education, and business series, “dissertations” is short for dissertations and theses.
This post is the overview. Each field has its own breakdown: sociology, political science and international relations, economics, public health, nursing and health professions, and communication.
Six fields, very different designs
Across the six fields, 21% of abstracts (10,778) name a quantitative method, 20% describe qualitative work, 13% a survey, and 9% a case study. But the fields differ enormously:
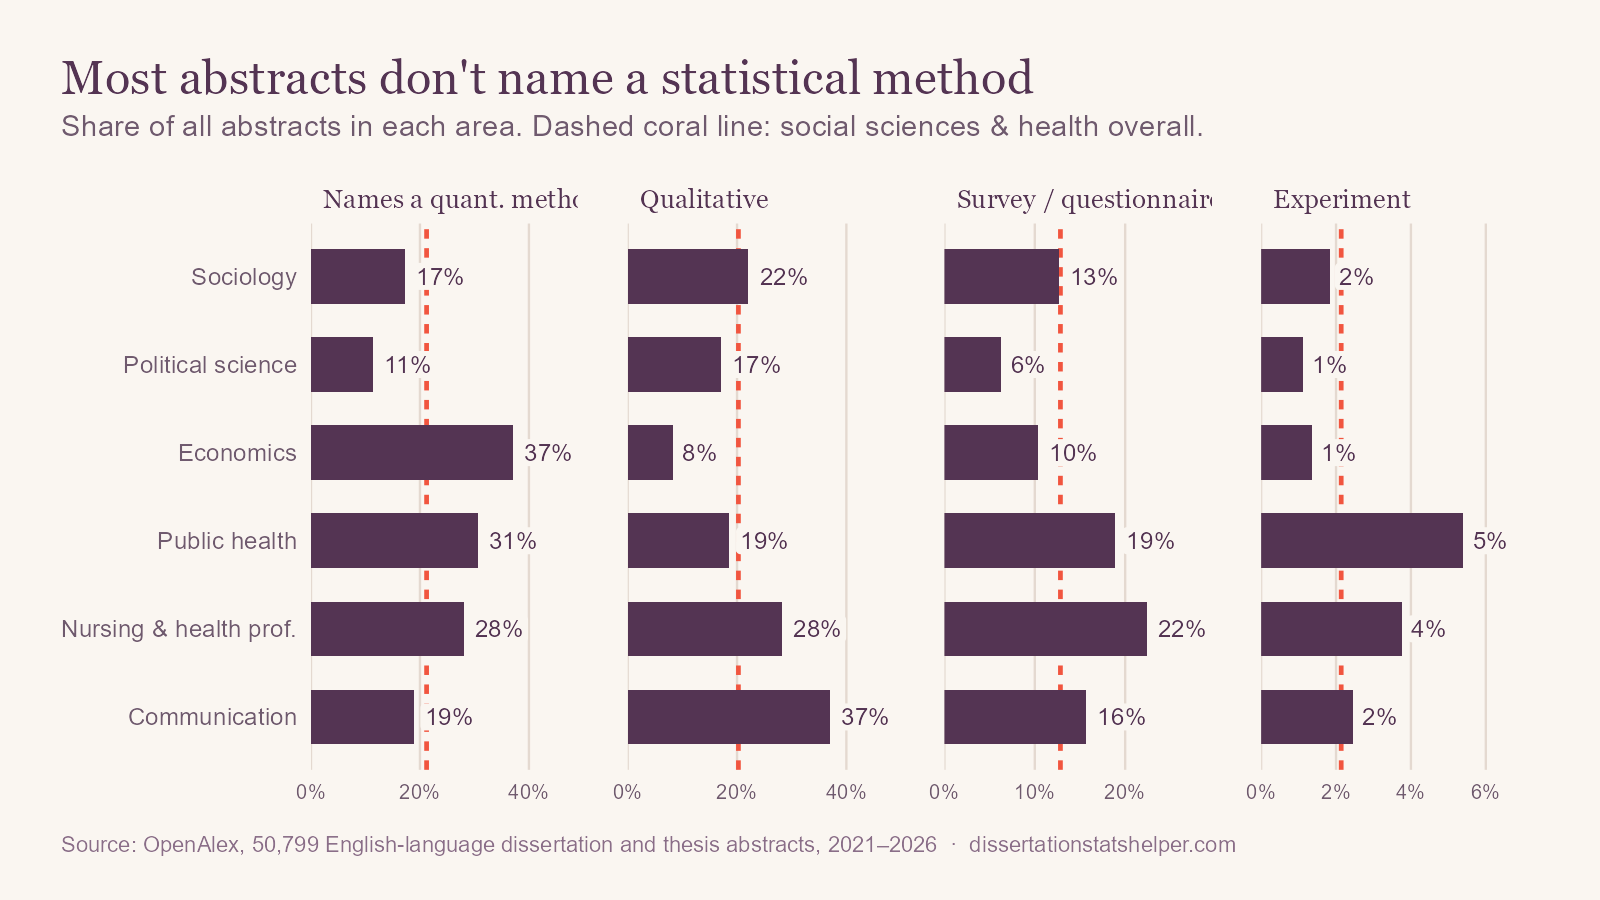
Economics is the most quantitative (37%) and the least qualitative (8%). Political science is the least quantitative (12%), with case studies and qualitative work instead. Communication is the most qualitative (37%). Public health and nursing lean on surveys (19% and 22%) and have the most experiments and trials (5% and 4%).
Three toolkits
Among the 10,778 method-naming abstracts, correlation leads (18%), followed by linear regression (14%), mediation (12%), moderation (8.5%), and panel data models (8%). By field, three toolkits emerge.
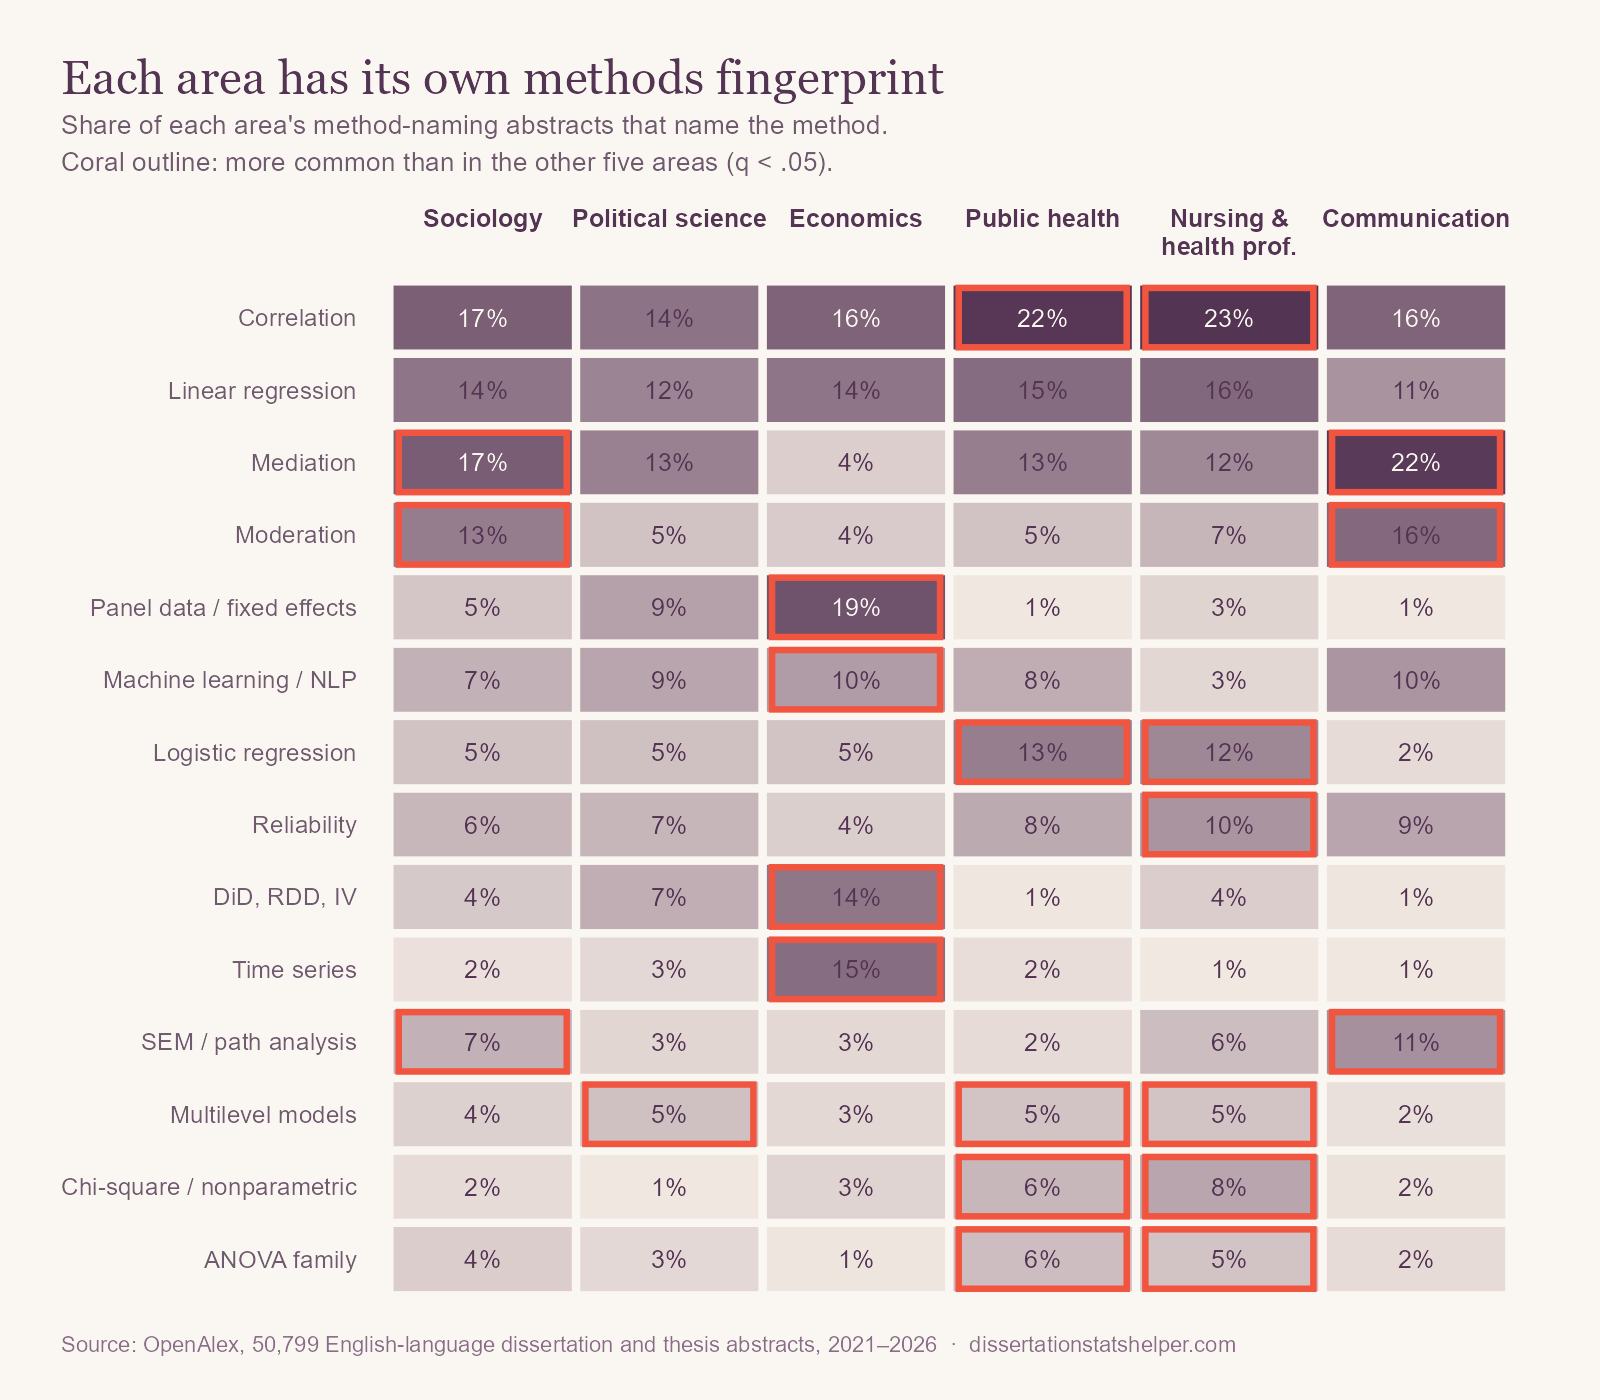
- Econometrics (economics, and to a lesser degree political science): panel data models, time series, and causal designs such as difference-in-differences, regression discontinuity, and instrumental variables.
- Health outcomes (public health, nursing and health professions): logistic regression for yes/no outcomes, chi-square comparisons, survival analysis, and count models.
- Survey models (sociology, communication): mediation, moderation, and structural equation models, along with text analysis and network analysis.
What changed since 2021
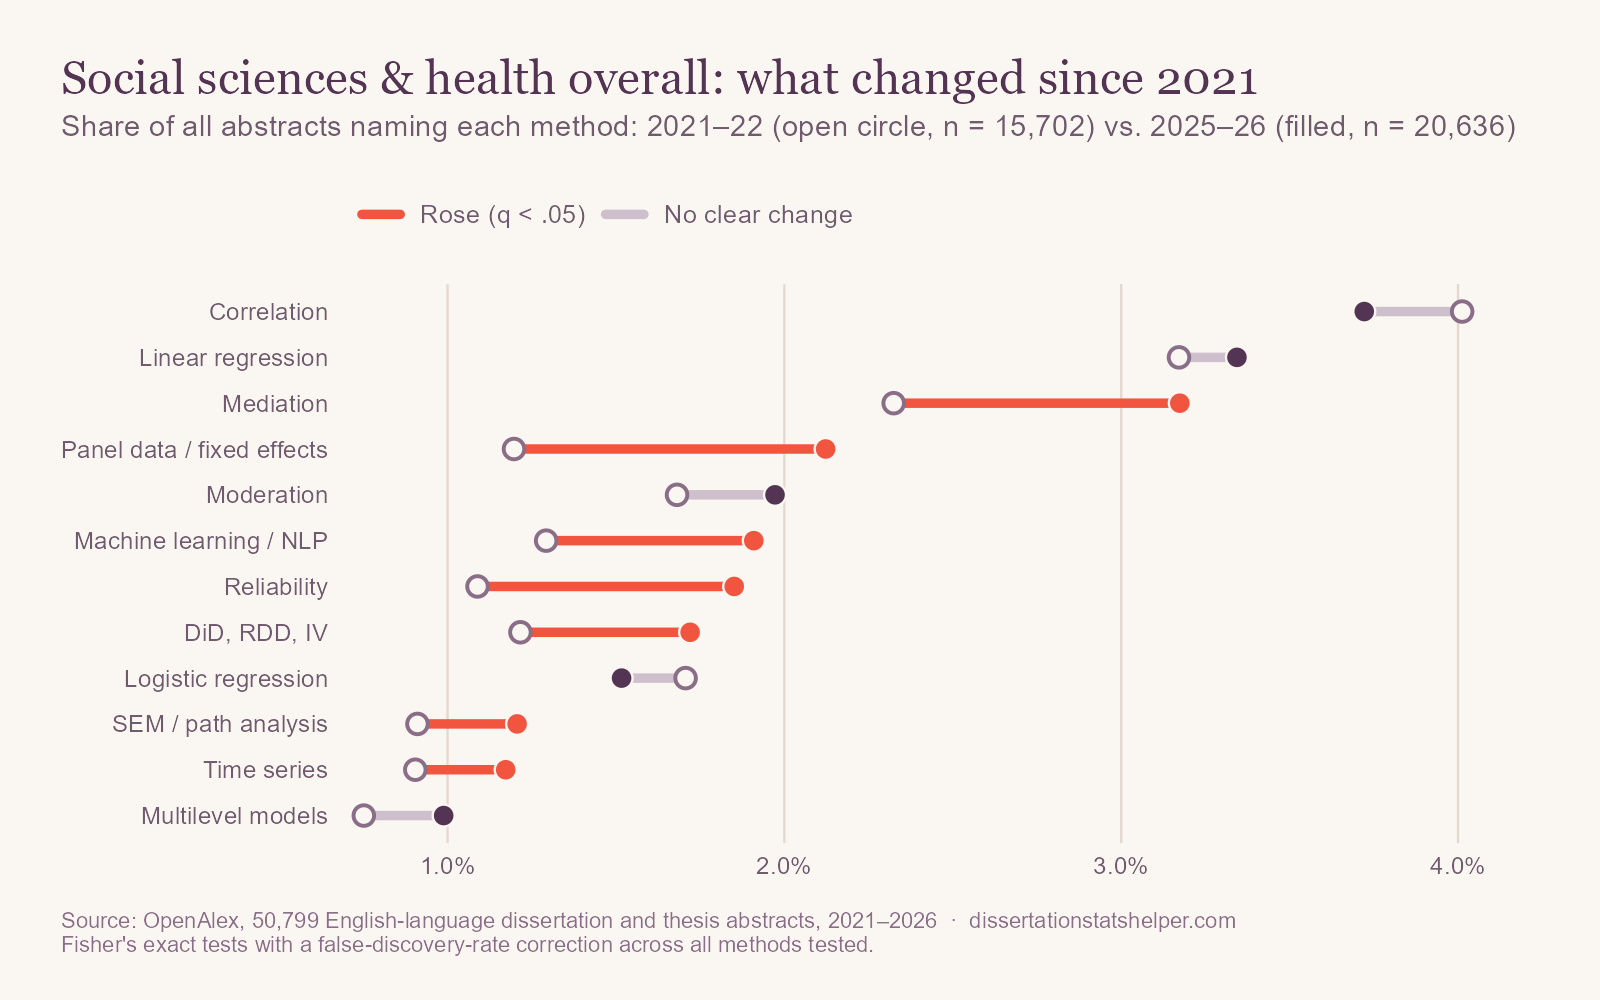
The share of abstracts naming a quantitative method rose from 20% to 24%. The biggest rises that survive our correction are in panel data models (1.2% to 2.1% of all abstracts), mediation (2.3% to 3.2%), reliability (1.1% to 1.9%), machine learning (1.3% to 1.9%), and causal designs (1.2% to 1.7%). Qualitative comparative analysis, a set-theoretic method, rose from 15 abstracts to 70. Most of the growth is in economics and sociology.
US-tagged work leans on regression and outcomes
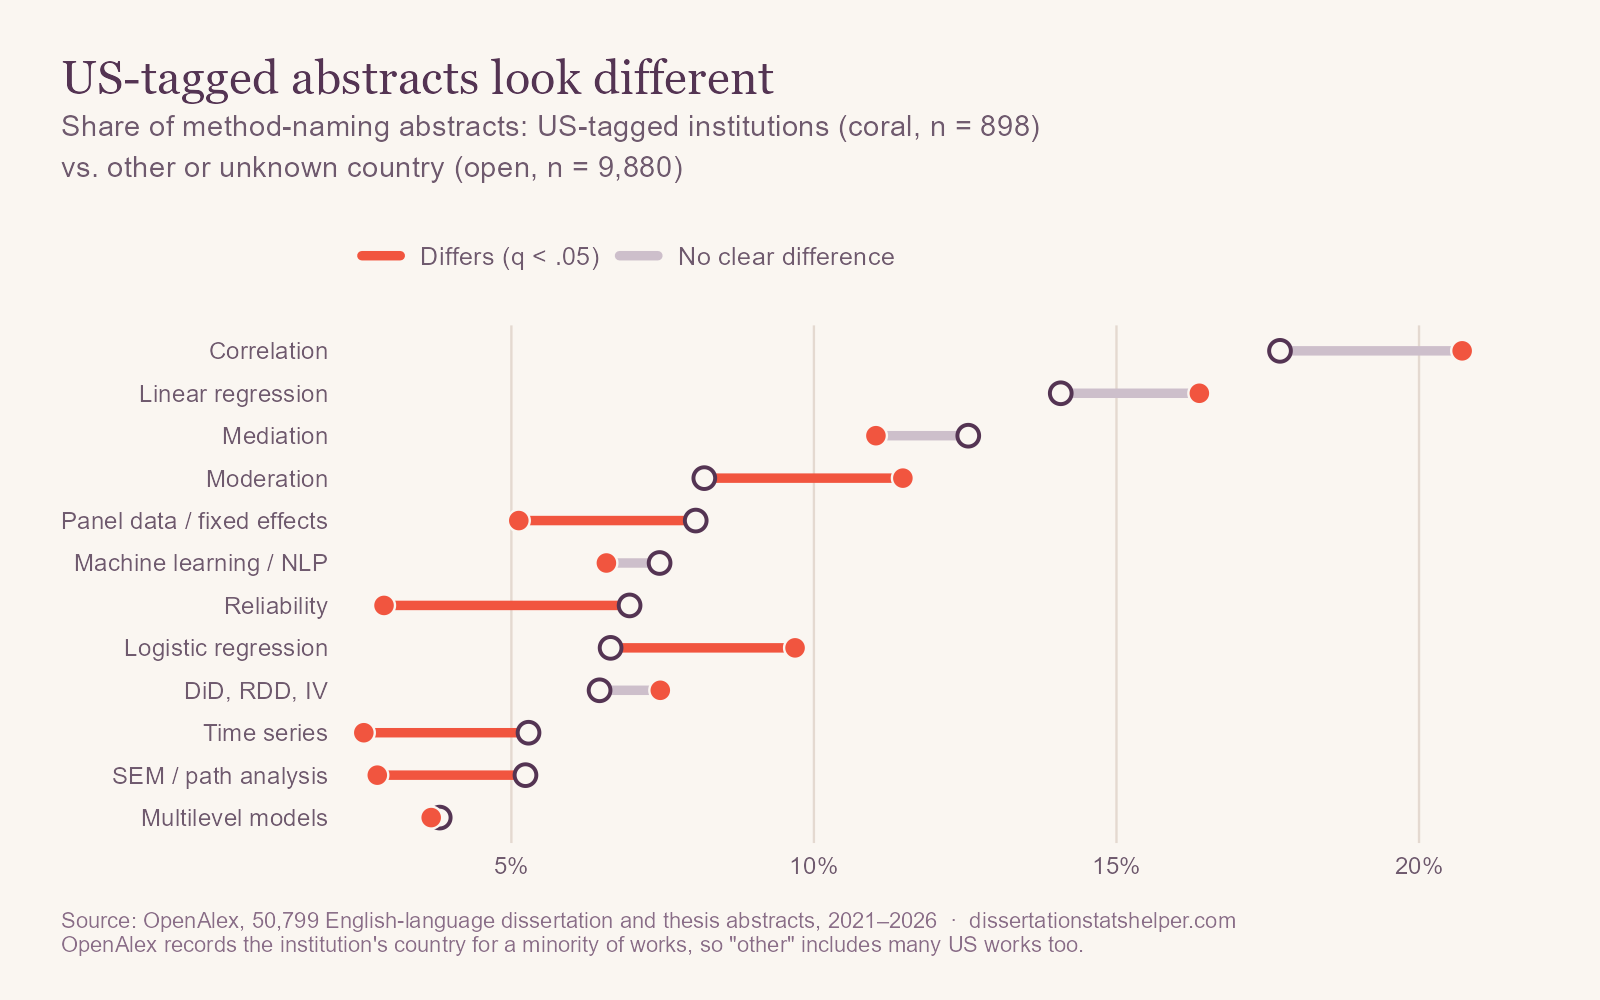
About 7% of these works are tagged as US institutions (country is known for 19%). The 898 US-tagged method-naming abstracts name logistic regression (10% vs. 7%), moderation (12% vs. 8%), t tests (4% vs. 2%), and spatial analysis (5% vs. 3%) more often, and reliability (3% vs. 7%), SEM (3% vs. 5%), PLS-SEM (0.2% vs. 2%), panel models (5% vs. 8%), and time series (3% vs. 5%) less often.
What abstracts leave out
Six of 50,799 abstracts mention a power analysis, and 50 mention missing data. In survey research and health studies, both are routine parts of a defensible design.
That fits APA’s own guidance. Its reporting standards ask a quantitative abstract for the research design, sample size, measures, and findings with effect sizes, not the name of the statistical test or the power analysis; those belong in the Method section. Our guide to writing a dissertation abstract covers what to include, with data on what real abstracts leave out.
What this means if you're planning a dissertation
- Know your field's toolkit. An economist, a public health researcher, and a sociologist will read the same regression table differently.
- Match the model to the outcome. Yes/no outcomes need logistic regression, counts need count models, and time to an event needs survival analysis.
- State what makes an estimate causal. Panel fixed effects, difference-in-differences, and instruments each rest on assumptions you should test.
- Plan power and missing data. They are almost invisible in abstracts and central to the defense.
Read the field breakdowns
- Sociology: mediation, moderation, and a broad mix of topics.
- Political science and international relations: the least quantitative field, with text and network methods.
- Economics: panel data, time series, and causal designs.
- Public health: logistic regression, survival, and count models.
- Nursing and health professions: surveys, logistic regression, and chi-square.
- Communication: mediation, SEM, and text analysis.
How we did this
We used OpenAlex to collect every English-language work typed as a dissertation or thesis, with an abstract, published from 2021 through September 2026, in these OpenAlex subfields: sociology and political science (labeled sociology here), political science and international relations, economics and econometrics, public health, nursing together with general health professions, and communication. We kept the 50,799 abstracts longer than 60 words and searched each title and abstract for about 40 methods using a keyword dictionary. We spot-checked matches and tightened patterns that caught false matches, such as conflict “mediation,” “computer-mediated,” everyday uses of “trajectory,” and “VaR” (value at risk).
Keep these limitations in mind. Percentages describe how often abstracts mention a method, not how often it was used. The data are international and include master's theses; country is known for only 19% of works. OpenAlex assigns fields by algorithm, and some groupings are broad: its sociology subfield, for example, includes digital marketing, tourism, and Islamic finance. OpenAlex's coverage changes over time, which can affect trends. Comparisons use Fisher's exact tests with a Benjamini–Hochberg false-discovery-rate correction across all methods tested.
The analysis code, the method dictionary, and the result tables behind every number here are on GitHub, under the MIT License.