
- abstracts analyzed
- 22,999
- name a quantitative method
- 17%
- of method-naming abstracts use mediation
- 17%
Sociology is the largest field in our analysis of 50,799 social science and health dissertation and thesis abstracts. OpenAlex's sociology subfield is broad, so read this post as a picture of social research in general, not only of sociology departments.
What is in this sample
The most common topics are marriage and family, digital marketing and social media, Islamic studies, digital games and media, tourism, misinformation, technology and adolescents, work–family balance, criminal justice, disaster management, and migration. Of the 22,999 abstracts, only 17% name a quantitative method, 22% describe qualitative work, 13% a survey, and 9% a case study.
The methods these dissertations name most
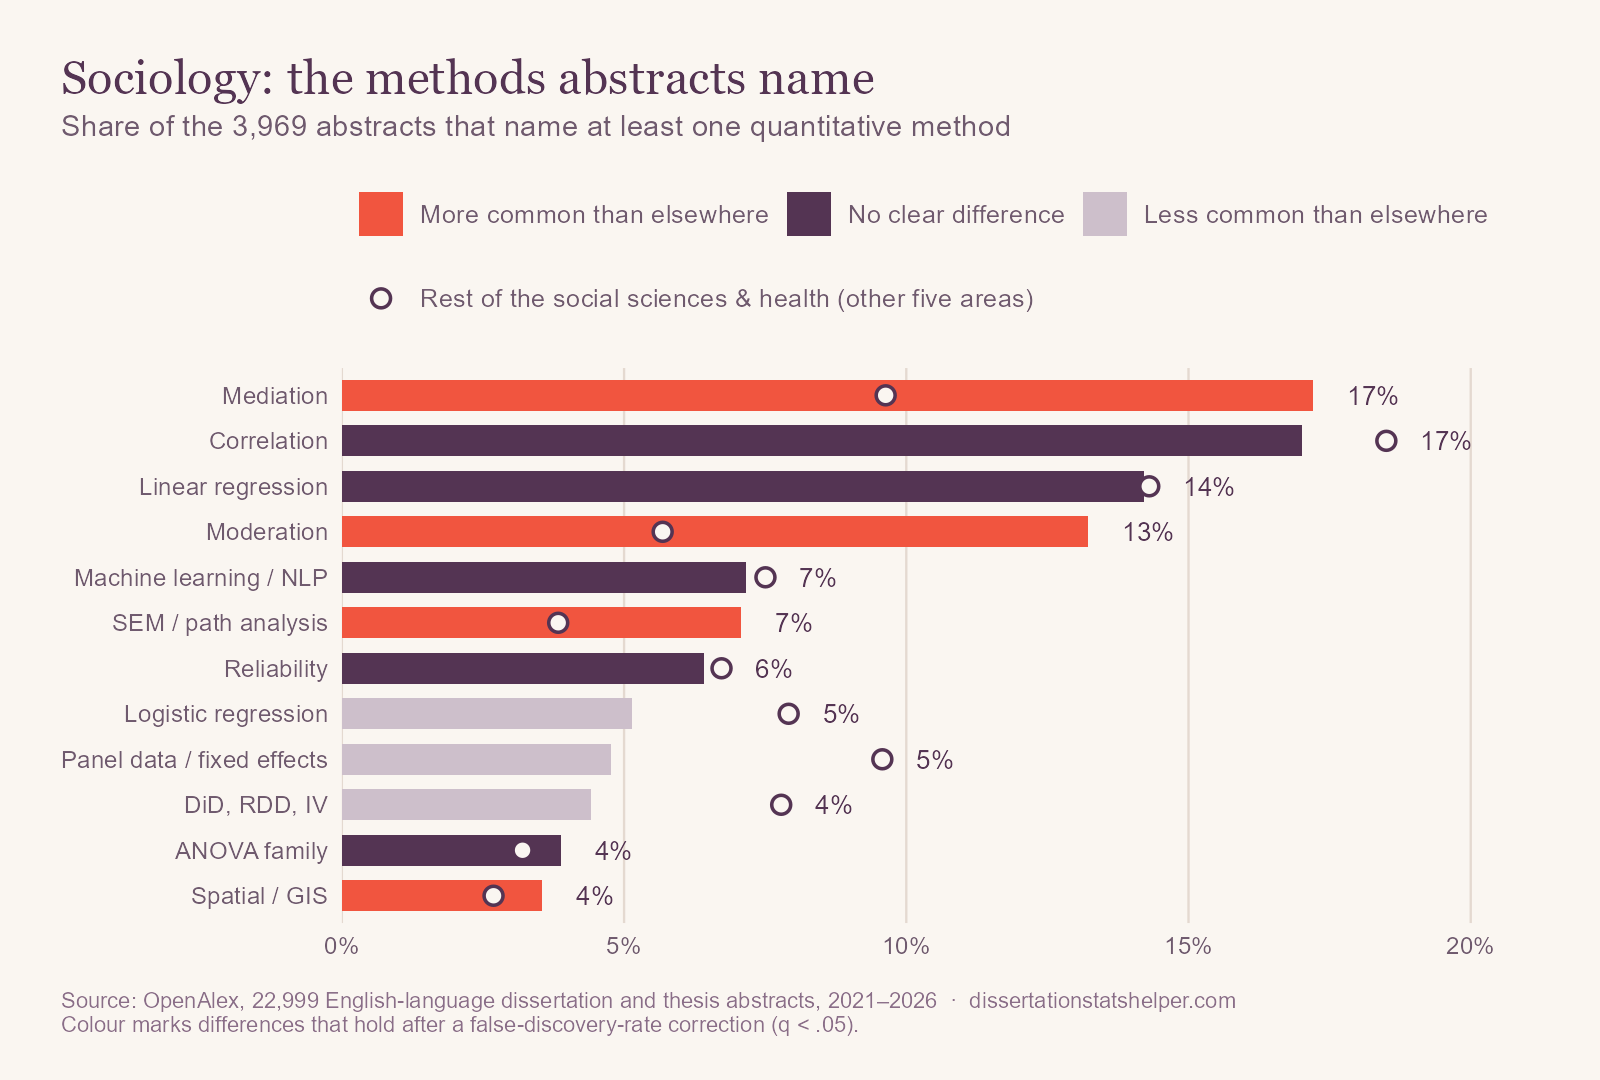
Mediation (17%) and correlation (17%) lead, followed by linear regression (14%) and moderation (13%). Compared with the other five fields, sociology names mediation (17% vs. 10%), moderation (13% vs. 6%), and SEM (7% vs. 4%) more often, along with text analysis (3.5% vs. 1.5%), PLS-SEM (3% vs. 1%), and qualitative comparative analysis (2% vs. 0.4%). Econometric methods are less common: panel data (5% vs. 10%), causal designs (4% vs. 8%), and time series (2% vs. 7%). Logistic regression is also less common (5% vs. 8%), which is surprising for classic sociological outcomes such as employment or arrest.
What changed since 2021
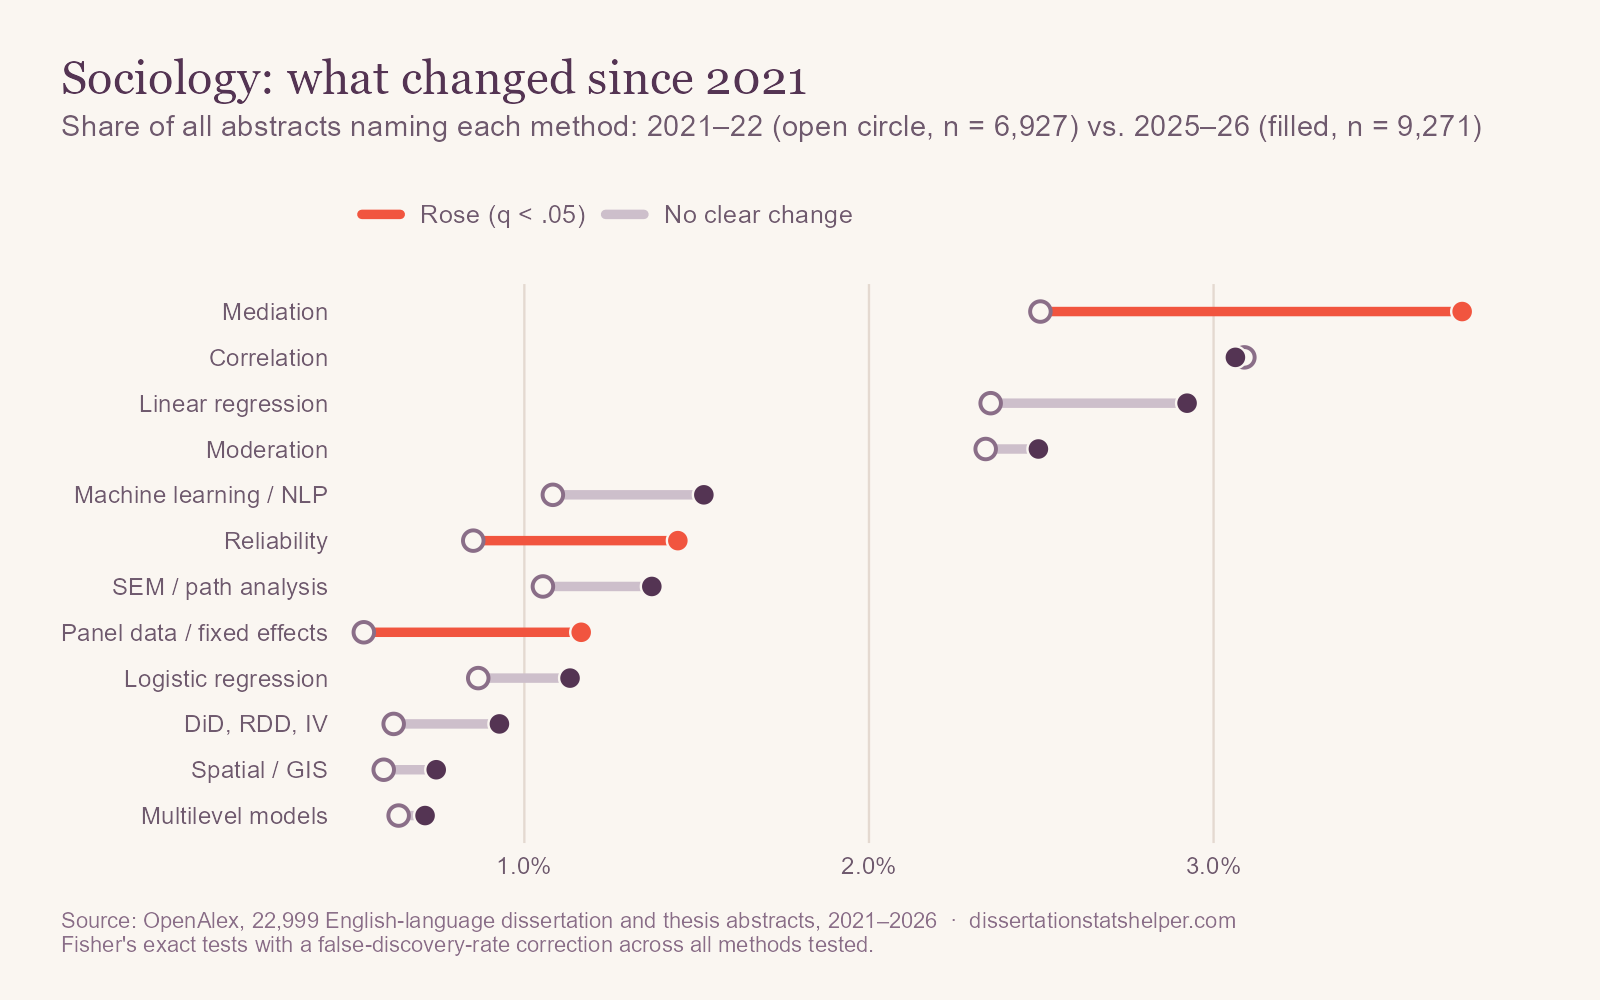
Sociology became slightly more quantitative (17% to 20% of abstracts). Mediation rose from 2.5% to 3.7% of all abstracts, panel data models from 0.5% to 1.2%, reliability from 0.9% to 1.4%, and text analysis from 0.4% to 0.8%. Qualitative comparative analysis grew fastest, from 10 abstracts to 51.
What these abstracts leave out
Five of 22,999 abstracts mention a power analysis, and 15 mention missing data. Survey-based sociology often relies on secondary data with complex sampling, and weights and missing responses need a plan.
If you're planning a sociology dissertation or thesis
- Use the right model for the outcome. Employment, arrest, and marriage are yes/no or count outcomes. Linear regression is rarely the best choice for them.
- Use survey weights with national data. Surveys such as the GSS or Add Health need weights and design information to produce population estimates.
- Be careful with mediation language. With cross-sectional data, describe indirect effects as consistent with a mechanism, not as proof of one.
- Account for context. People nested in neighborhoods, schools, or countries call for multilevel models.
How we did this
We used OpenAlex, an open index of scholarly works, to collect every English-language dissertation and thesis with an abstract published from 2021 through September 2026 in this field, and searched each title and abstract for about 40 statistical methods, including econometric and health methods such as panel models, difference-in-differences, and survival analysis. The data include master's theses and many works from outside the United States, so “dissertations” here is short for all of them. Percentages describe how often abstracts mention a method, not how often it was used. Comparisons use Fisher's exact tests with a false-discovery-rate correction, and OpenAlex's coverage changes over time, so treat trends with some caution. The overview post has the full method and its limitations. The analysis code and result tables are on GitHub.