
- abstracts analyzed
- 5,636
- describe a survey
- 22%
- of method-naming abstracts use logistic regression
- 12%
Nursing and the health professions produce many practice-focused doctorates, including DNP projects. In our analysis of 50,799 social science and health dissertation and thesis abstracts, this field combines surveys of patients and staff with health outcomes.
What is in this sample
This group combines OpenAlex's nursing field with its general health professions subfield, and the topics are broad: homelessness, food security, child nutrition, healthcare quality and satisfaction, nursing education and management, adolescent health, geriatric care, and health professionals' stress and burnout. Of the 5,636 abstracts, 28% name a quantitative method, 28% describe qualitative work, and 22% describe a survey, the highest survey share in this series.
The methods these dissertations name most
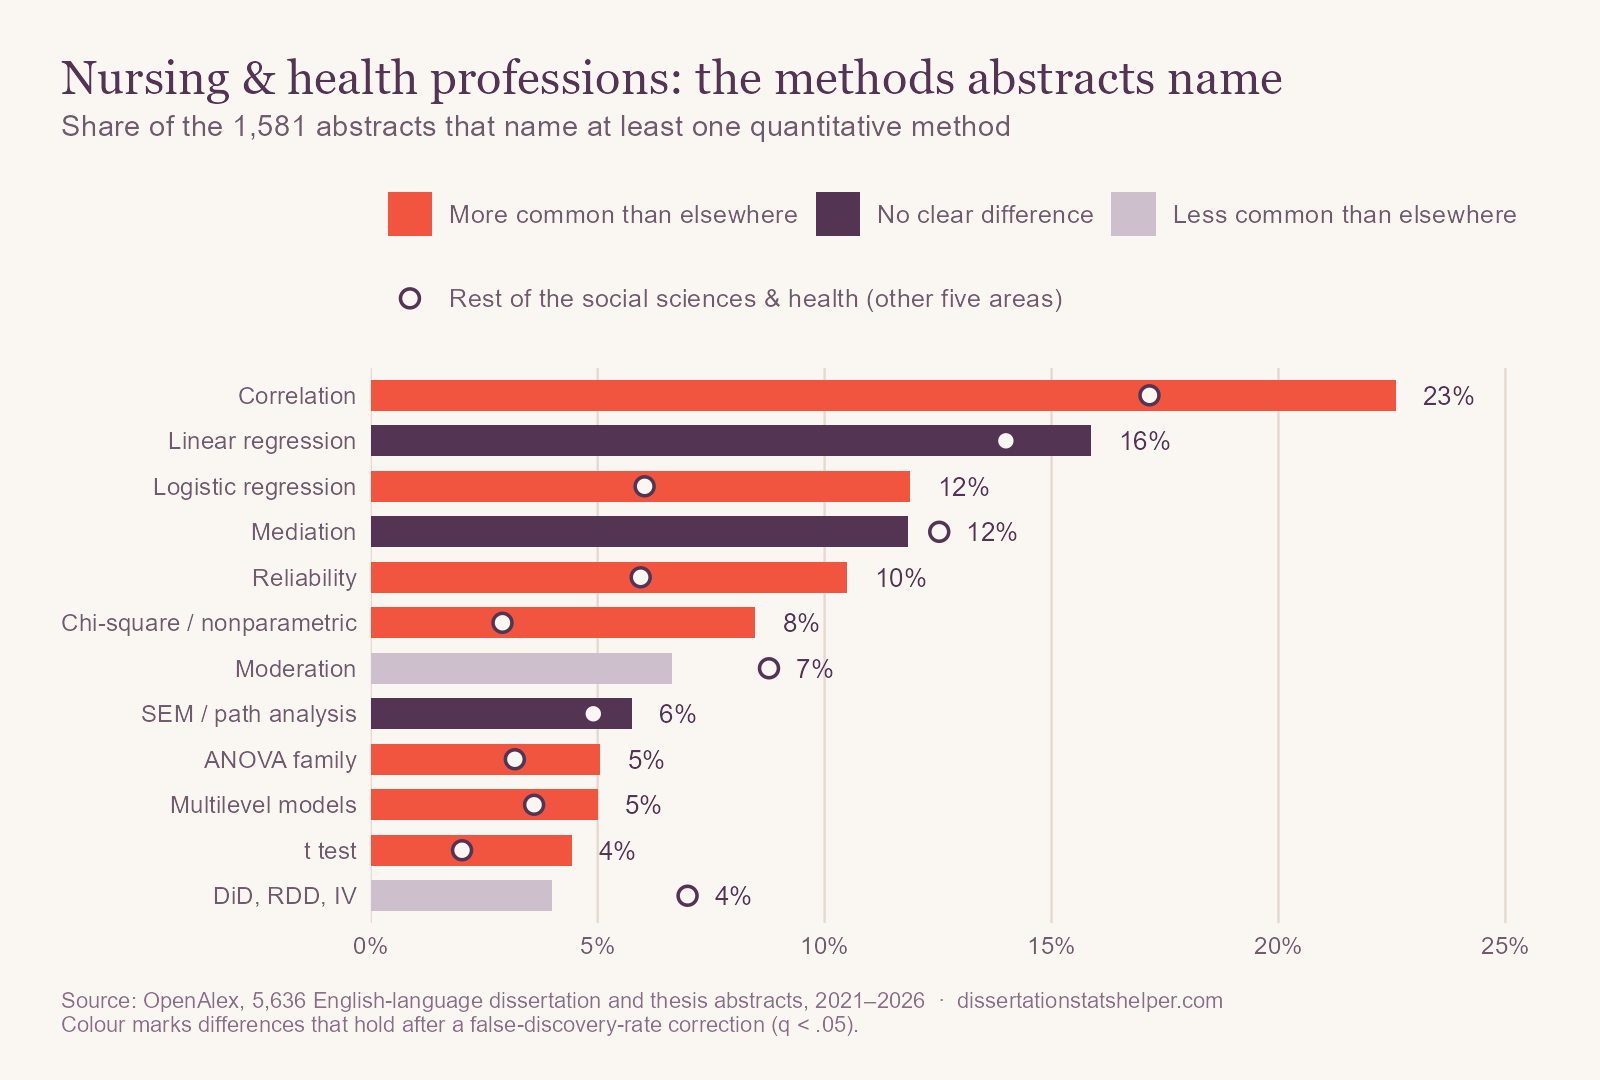
Compared with the other five fields, nursing and health professions name logistic regression (12% vs. 6%), chi-square (9% vs. 3%), correlation (23% vs. 17%), reliability (11% vs. 6%), t tests (4% vs. 2%), and scale development (3% vs. 1%) more often. This is the toolkit of survey and clinical-practice research. Machine learning (3% vs. 8%) and econometric methods are rare.
What changed since 2021
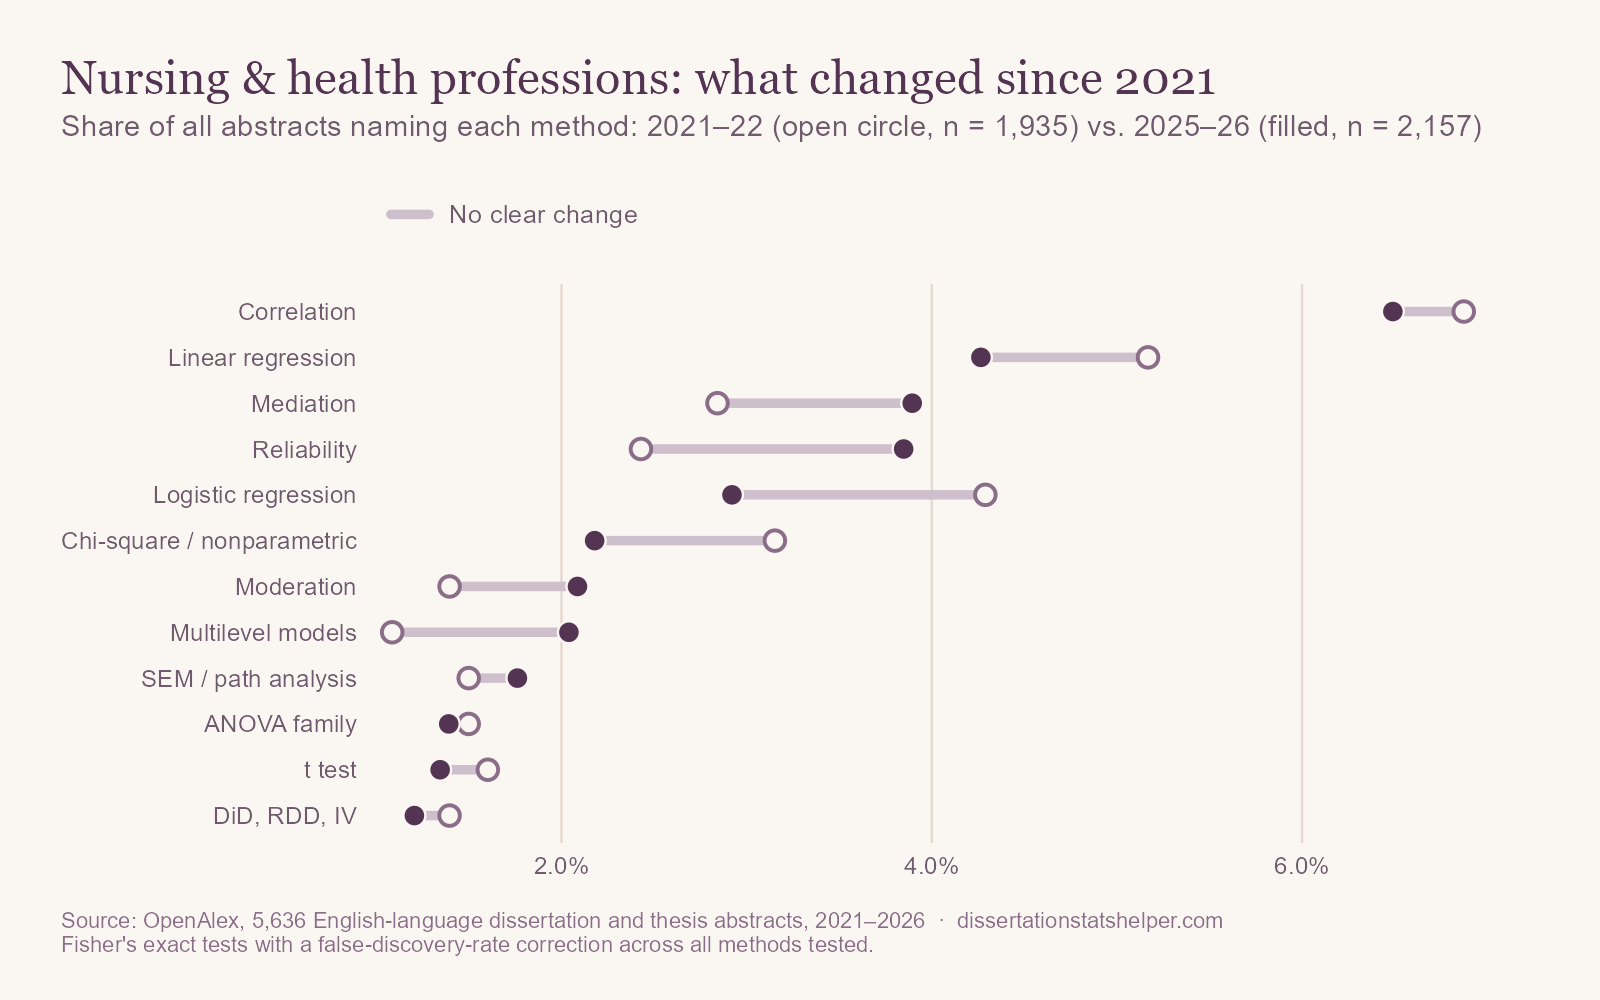
Nothing changed clearly. The share naming a quantitative method held at about 29–30%. Reliability (2.4% to 3.8% of abstracts) and multilevel models (1.1% to 2.0%) rose, and logistic regression fell (4.3% to 2.9%), but none survives our correction.
What these abstracts leave out
None of the 5,636 abstracts mentions a power analysis, and six mention missing data. Quality improvement projects on a single unit often have small samples, so what the data can and cannot show should be part of the plan.
If you're planning a nursing or health professions dissertation or DNP project
- For quality improvement projects, track change over time. Run charts and control charts show whether a change is a real signal or normal variation, better than a single before–after comparison.
- Pair chi-square tests with effect sizes. Report odds ratios or risk differences with confidence intervals, not only p-values.
- Check your instruments. Report reliability in your own sample, especially for translated or adapted surveys.
- Account for units and facilities. Nurses and patients within the same unit share context; with several units, use a multilevel model.
How we did this
We used OpenAlex, an open index of scholarly works, to collect every English-language dissertation and thesis with an abstract published from 2021 through September 2026 in this field, and searched each title and abstract for about 40 statistical methods, including econometric and health methods such as panel models, difference-in-differences, and survival analysis. The data include master's theses and many works from outside the United States, so “dissertations” here is short for all of them. Percentages describe how often abstracts mention a method, not how often it was used. Comparisons use Fisher's exact tests with a false-discovery-rate correction, and OpenAlex's coverage changes over time, so treat trends with some caution. The overview post has the full method and its limitations. The analysis code and result tables are on GitHub.