
- abstracts analyzed
- 3,354
- of method-naming abstracts use machine learning
- 18%
- the Bayesian rate elsewhere
- 3×
Experimental and cognitive psychology is the most computational corner of our analysis of 21,308 psychology dissertation and thesis abstracts. It is also the subfield where the classic experimental tests are named least.
What is in this sample
The most common topics are phonetics and phonology, emotion and mood recognition, dance, mental health, language and metaphor, creativity, and sleep. Some of these theses sit between psychology and engineering, such as emotion recognition from speech or automated sleep staging, and they account for much of the machine learning. Of the 3,354 abstracts, 36% name a quantitative method, and only 14% describe qualitative work, the lowest share of any subfield.
The methods these dissertations name most
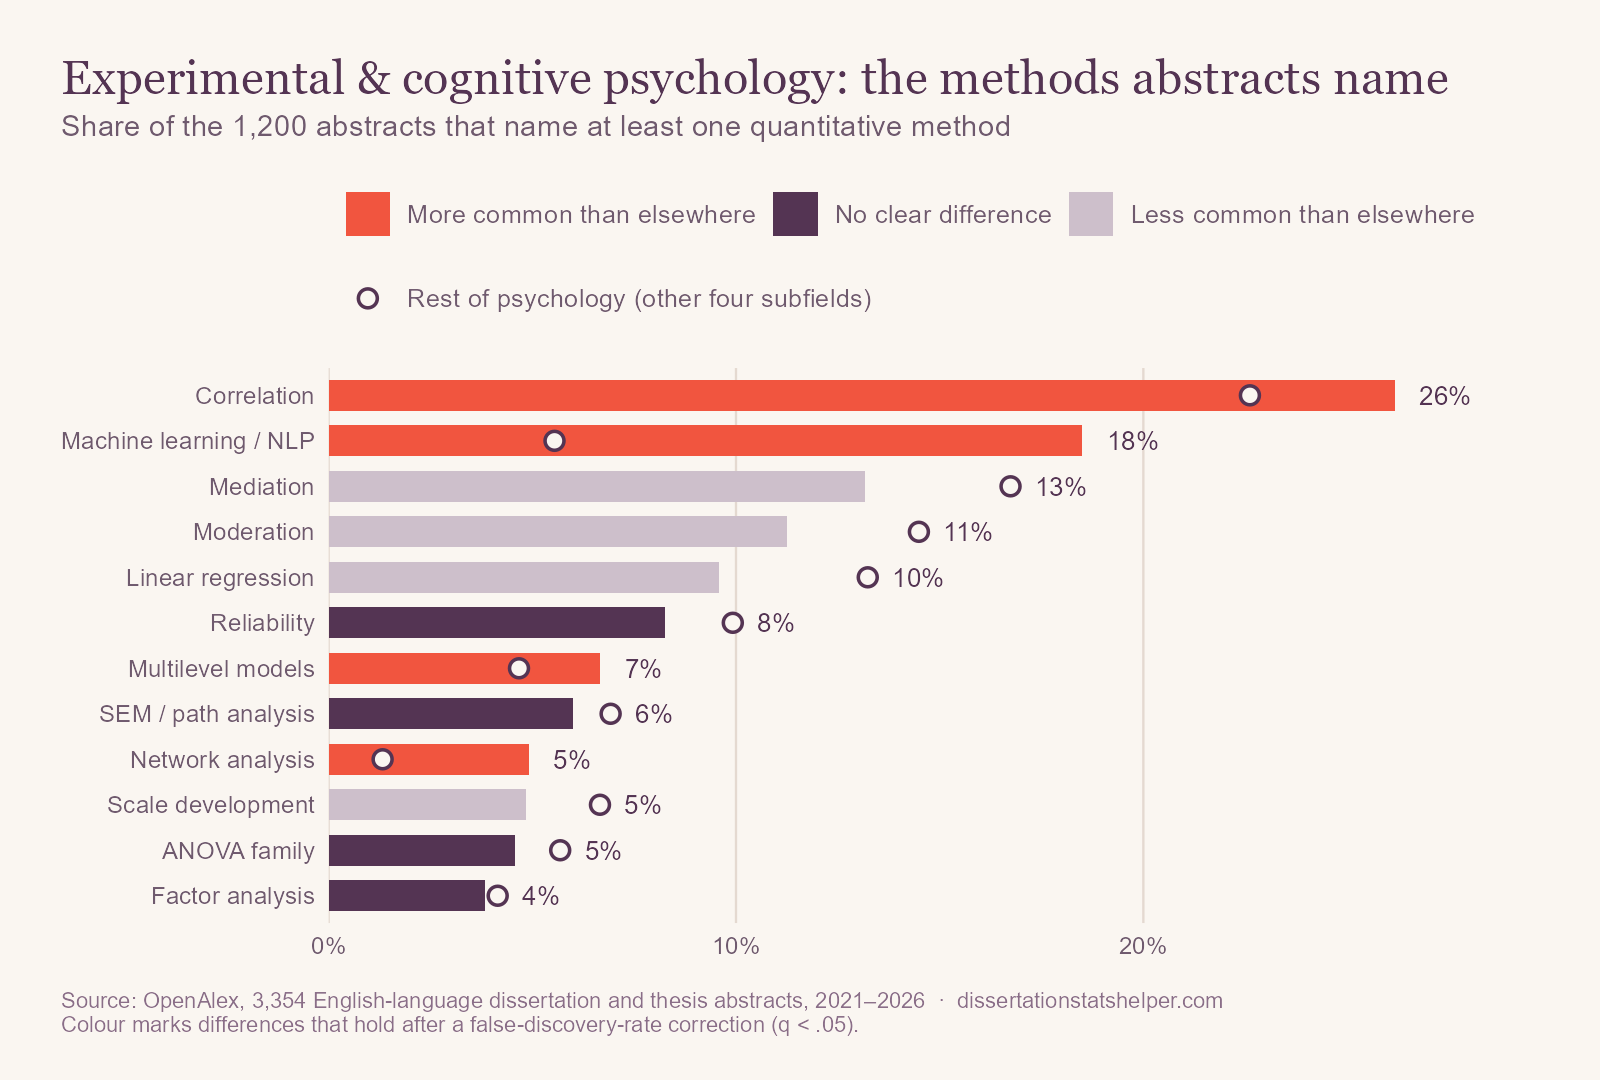
Five methods are clearly more common here than in the other four subfields:
- Machine learning and natural language processing (18% vs. 6%): classifiers for speech, faces, physiological signals, and text.
- Psychometric network analysis (5% vs. 1%): modeling symptoms or cognitive abilities as a network of connected parts.
- Bayesian methods (3% vs. 1%): Bayes factors and Bayesian models, which are more at home in cognitive modeling than anywhere else in psychology.
- Multilevel models (7% vs. 5%): trials nested within participants.
- Correlation (26% vs. 23%).
The surprise is what's rare. Only 8% of abstracts describe an experiment, t tests appear in 2% of method-naming abstracts (vs. 6% elsewhere), and ANOVA in 5%. Experimental abstracts tend to report the effect (“participants responded faster when…”) rather than the test behind it.
What changed since 2021
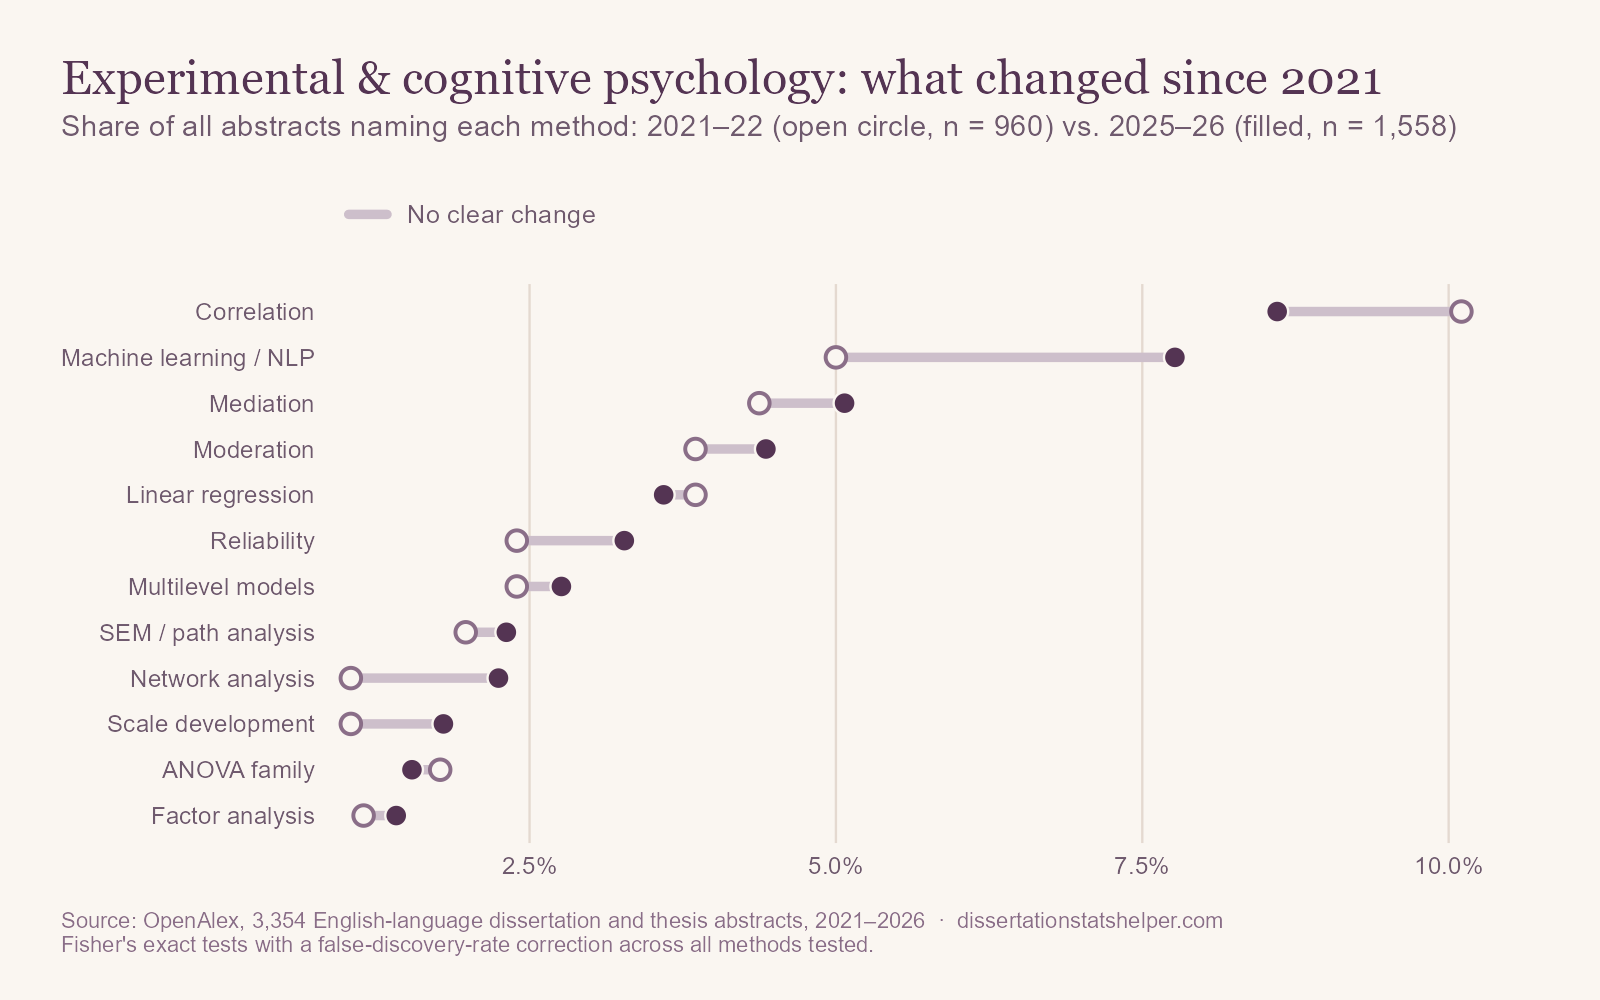
The subfield became more quantitative: 32% of abstracts named a quantitative method in 2021–22 and 39% in 2025–26 (p = .001). Machine learning rose from 5.0% to 7.8% of abstracts, text analysis from 1 abstract to 15, and network analysis from 10 to 35. None of these individual rises survives our correction for testing about 30 methods, so treat them as a direction to watch rather than an established trend.
What these abstracts leave out
Two of 3,354 abstracts mention a power analysis, and four mention missing data. In experimental work, power depends on both the number of participants and the number of trials each completes, so a sample-size plan is rarely a single number.
If you're planning an experimental or cognitive psychology dissertation or thesis
- Model trials, not averages. Mixed-effects models with random effects for participants (and for items, where they vary) use every trial and handle unbalanced data. Report the random-effects structure you used and why.
- Plan power by simulation. For mixed models, simulate data from plausible effect sizes and variance components to choose both the number of participants and the number of trials.
- Keep machine learning honest. Split training and test data by participant, not by trial, so the model can't recognize people it has already seen. Report performance against a simple baseline.
- If you go Bayesian, show your priors. Report them, justify them, and check how much your conclusions depend on them.
How we did this
We used OpenAlex, an open index of scholarly works, to collect every English-language dissertation and thesis with an abstract published from 2021 through September 2026 in this subfield, kept abstracts longer than 60 words, and searched each title and abstract for about 30 statistical methods. The data include master's theses, so “dissertations” in this post is short for both. Percentages describe how often abstracts mention a method, not how often it was used. Comparisons use Fisher's exact tests with a false-discovery-rate correction, so a difference is only called a difference when it survives testing every method at once. The overview post has the full method and its limitations. The analysis code and result tables are on GitHub.