
- abstracts analyzed
- 707
- name a quantitative method
- 42%
- describe an experiment
- 12%
Applied psychology is the smallest of the five subfields in our analysis of 21,308 psychology dissertation and thesis abstracts, so its numbers are less precise than the others. Even so, it has a clear character: it is where psychology dissertations test interventions most often.
What is in this sample
Two kinds of work dominate. Digital mental health interventions (295 abstracts) and other behavioral health interventions (153) make up most of the sample, followed by human resource development and performance evaluation (119), optimism and well-being, and coaching. Applied abstracts are the most likely in psychology to name a quantitative method (42%) and to describe an experiment (12%, twice the psychology-wide 6%). They also mention mixed methods (8%) and surveys (27%) more often than any other subfield.
The methods applied dissertations name most
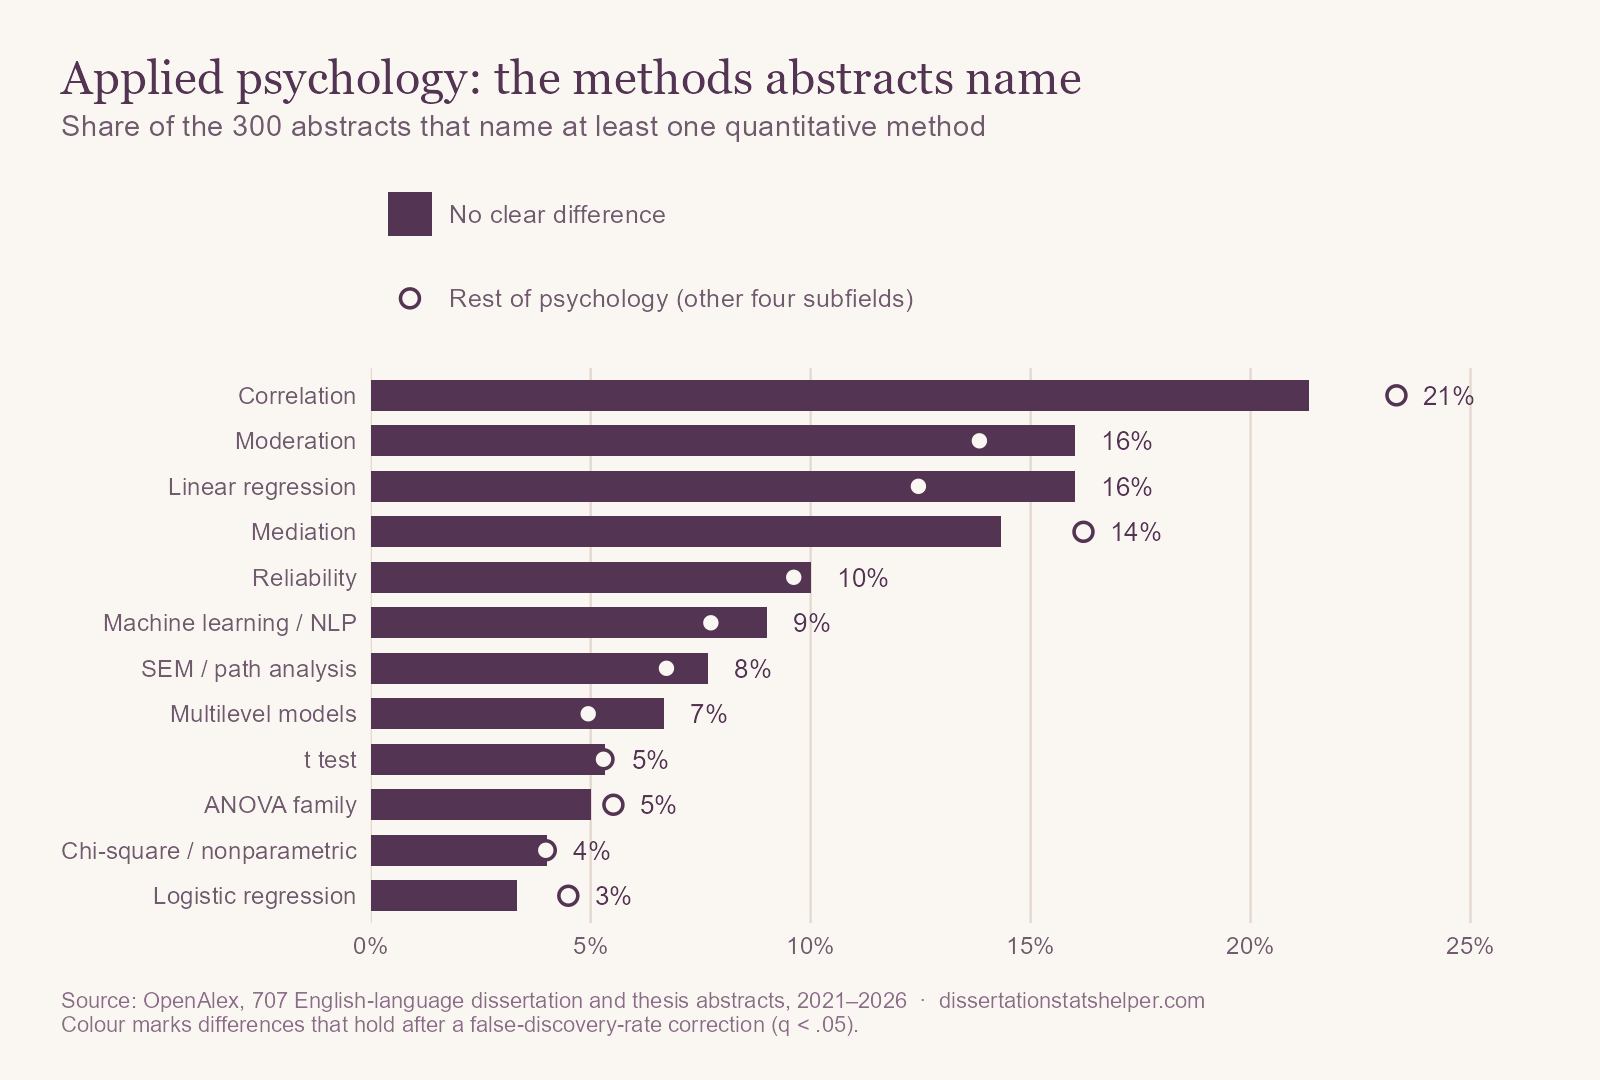
Correlation (21%), linear regression (16%), moderation (16%), and mediation (14%) lead. Regression and moderation are named more often here than in the other subfields (16% vs. 12%, and 16% vs. 14%), a profile close to clinical psychology. But with 300 method-naming abstracts, each percentage has a margin of error of four to five points, and no difference from the rest of psychology survives our correction. What we can say is that nothing in applied dissertations looks unusual. The same core methods carry the work.
What changed since 2021
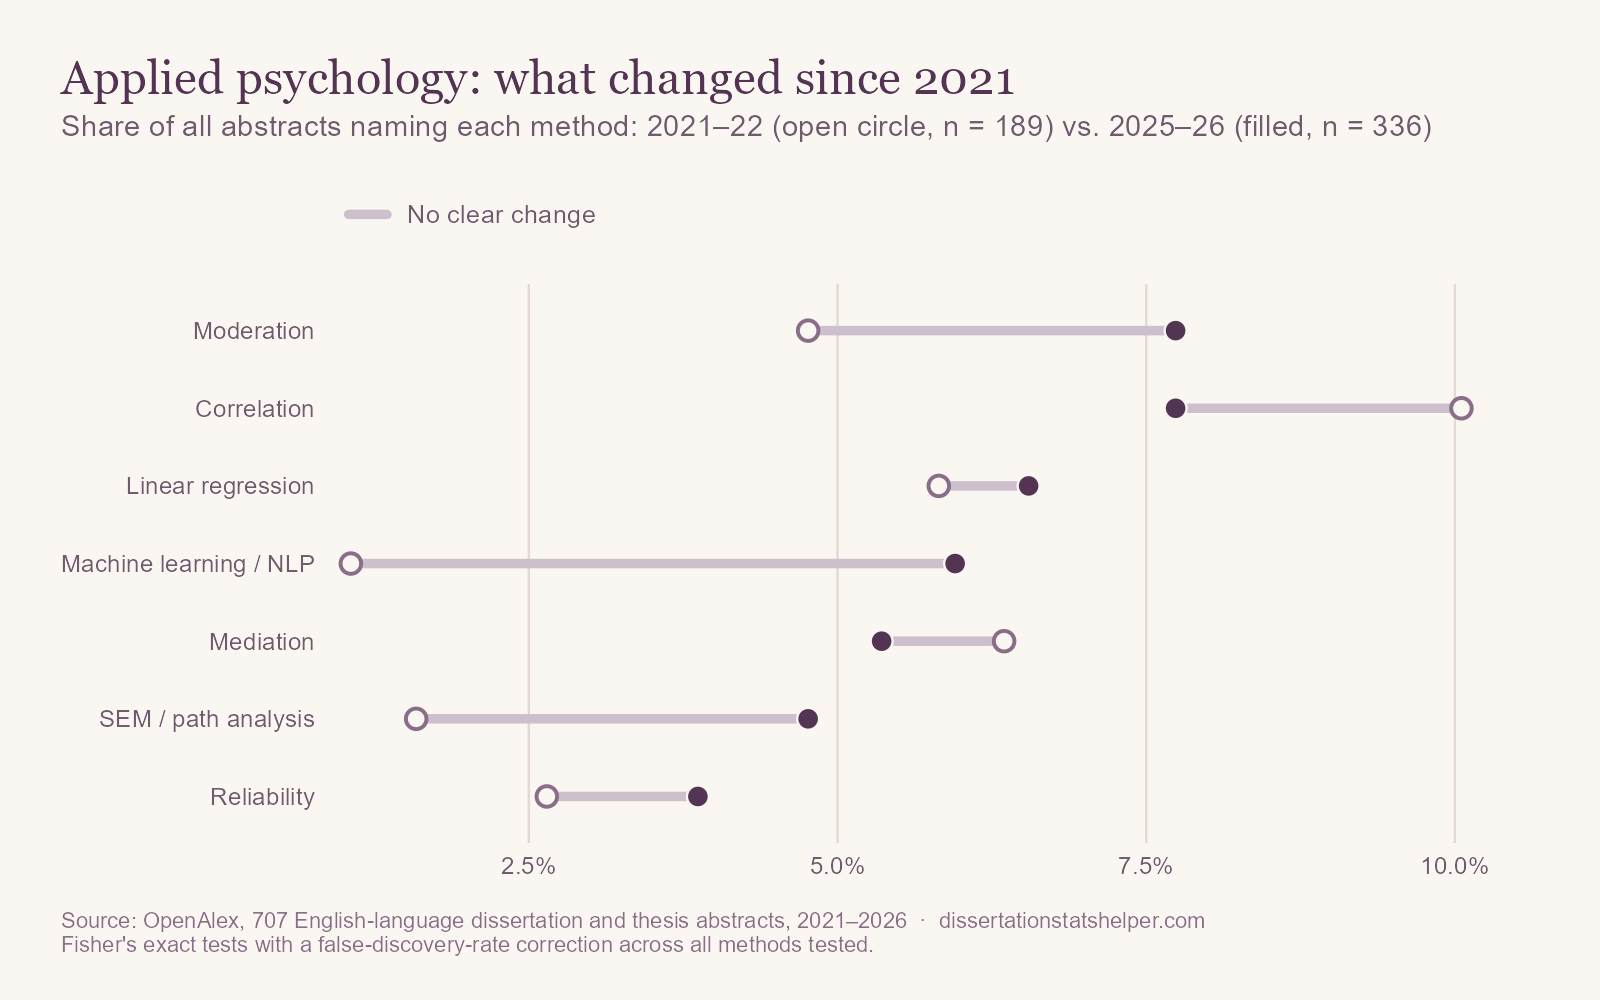
Machine learning went from 2 abstracts in 2021–22 (1.1%) to 20 in 2025–26 (6.0%), and structural equation models from 3 to 16. Those are large relative jumps on small counts, and neither survives our correction. With 189 abstracts in the early period, one or two more years of data will tell whether they are trends.
What applied abstracts leave out
None of the 707 abstracts mentions a power analysis, and three mention missing data. For intervention research, both matter a great deal: digital interventions in particular lose participants quickly, and how you handle those who drop out can change the result.
If you're planning an applied psychology dissertation or thesis
- Plan for attrition from day one. In app-based and online interventions, engagement drops fast. Decide in advance how you'll analyze people who stop participating, report intention-to-treat results, and use methods that handle missing data properly, such as multiple imputation or full-information maximum likelihood.
- Use repeated measures fully. If you measure people several times, a mixed-effects model uses every observation and handles uneven follow-up better than comparing first and last scores.
- Account for teams and organizations. Employees nested in teams, or clients nested in coaches, are not independent observations.
- Watch for common-method bias. When the predictor and outcome both come from the same self-report survey at the same time, correlations are inflated. Separate them in time or source where you can.
How we did this
We used OpenAlex, an open index of scholarly works, to collect every English-language dissertation and thesis with an abstract published from 2021 through September 2026 in this subfield, kept abstracts longer than 60 words, and searched each title and abstract for about 30 statistical methods. The data include master's theses, so “dissertations” in this post is short for both. Percentages describe how often abstracts mention a method, not how often it was used. Comparisons use Fisher's exact tests with a false-discovery-rate correction, so a difference is only called a difference when it survives testing every method at once. The overview post has the full method and its limitations. The analysis code and result tables are on GitHub.